|
10 Minute Bar Charts 4/30/02 Dow Jokes Inflatables
Archives 12/30/01, 1/1/02, 1/2/02, 1/3/02, 1/4/02, 1/7/02, 1/8/02, 1/09/02, 1/10/02, 1/11/02, 1/14/02, 1/15/02, 1/16/02, 1/17/02, 1/18/02, 1/22/02, 1/23/02, 1/24/02, 1/25/02, 1/28/02, 1/29/02, 1/30/02, 1/31/02, 2/1/02, 2/4/02, 2/5/02, 2/06/02, 2/7/02, 2/9/02, 2/11/02, 2/12/02, 2/13/02, 2/14/02, 2/16/02, 2/19/02, 2/20/02, 2/21/02, 2/23/02, 2/25/02, 2/26/02, 2/27/02, 2/28/02, 3/1/02, 3/04/02, 3/05/02, 3/06/02, 3/7/02, 3/10/02,3/11/02, 3/12/02, 3/13/02, 3/14/02, 3/15/02, 3/18/02, 3/19/02, 3/20/02, 3/21/02, 3/22/02, 3/25/02, 3/26/02, 3/28/02, 3/30/02 4/1/02, 4/2/02, 4/3/02, 4/4/02, 4/6/02, 4/8/02, 4/9/02, 4/10/02, 4/11/02, 4/13/02, 4/15/02, 4/16/02, 4/17/02, 4/18/02, 4/20/02, 4/22/02, 4/23/02,4/24/02,4/25/02, 4/26/02, 4/27/02, 4/29/02
|
The Anals of Stock ProctologyPublished 5 times
per week by the American Academy of Stock Proctology and Momma Market Spanks The Bears (4/30/02) Well, they did it to us good today. Moral of the story: Never laugh at the market. Never laugh at the bulls. Always maintain a healthy dose of fear. Because when you're feeling too good about things, and you're jumping up and down on the mattress like a drunken chimpanzee, that's when you know the other side is sold out, and Momma Market is about to come in and smack you in the butt. Take it from Doc, who knows this from long experience. We are our own best contrary indicators. Of course it helps if your favorite indicators are falling off the bottom of the chart, and prices are at the low end of the cycle wave channels. Which is exactly what happened between late Tuesday and mid day Wednesday. We got's what we deserved, troops. So, now that we've had our dose of market medicine, is it time to go back in headlong short? Cut back on short positions? What? That all depends on your trading time horizon. A good rule is always to wait for the signal on the time cycle you are trading. So far, only the 13 day cycle has turned up. It may only go sideways for a few days, but if you are trading that cycle you should be regrouping. All of the longer cycles still point down, but we are in a risky time window from the standpoint of a 10-13 week cycle low. If you are trading that cycle or the 6-7 week cycle, you can wait for the oscillators to turn up. Overall we're back in one of those all too common murky periods where the odds aren't real clear, definitely not an ideal time to be instituting new positions. In fact, it looks like we may begin yet another of those seemingly interminable trading ranges, only this time a step down from the last one. This does not appear to be a time of great opportunity for shorting the market as a whole. Doc will have a look at some sectors in the morning to see if anything drops out. The Feed added a $5 billion overnight repo today while the clock was still ticking on yesterday's 3 day $7.5 billion repo. $7.6 billion in permanent paper matured today (Tuesday). The $5 billion add may have in response to the market meltdown, or it may not have. They had given themselves some slack by letting the toilet drain the past couple of weeks and the bond market has been cutting them slack as well, so it's possible they were supporting the market. On the other hand, this Thursday, Monday's $7.5 billion 3 day repo and $ 5 billion in 28 day repos will mature. That means that in order to maintain the support, they are going to have to keep pumping big on Wednesday and Thursday. If they do, the market may hold together for a bit. But if the Fed goes back to sitting on its hands, look for the market to tank. Dow Inflatables
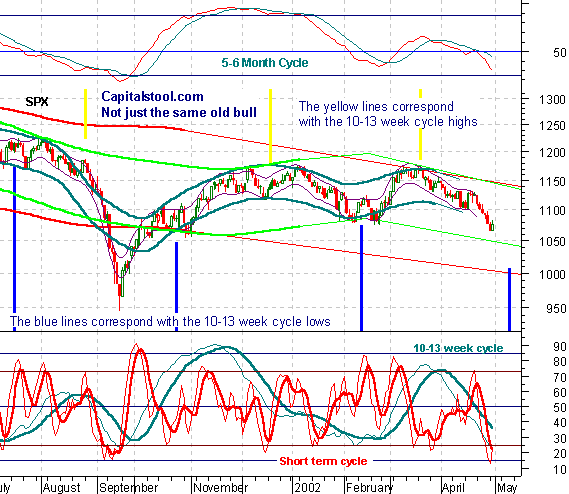
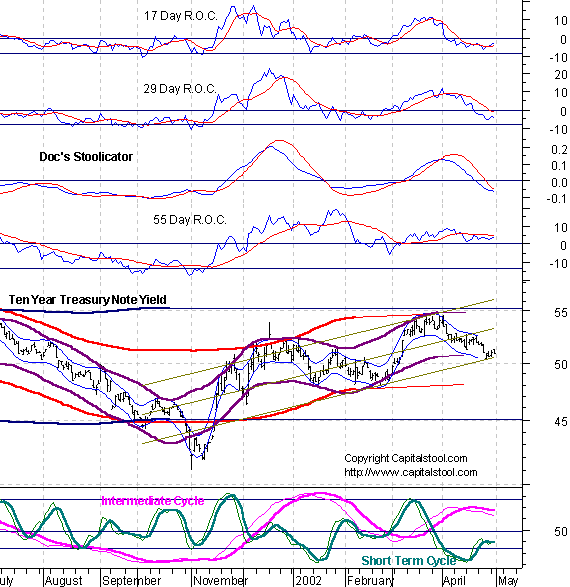
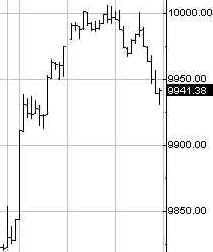
Portfolio Sphincters Index (SPX) and Sentiment The SPX reversed Monday's loss with a gain of 11 to 1076, barely back within its short term linear regression channel. The 17 day rate of change, a proxy for the 6-7 week cycle, remains at the same level from which the last two market bounces sprang. If it breaks lower from here, the decline is likely to accelerate. If it turns up, they'll probably run back to 1100 and then some. The 6-7 week cycle oscillator superimposed on the chart has started to roll over very late, but the smoother hasn't followed. Late sell signals are usually extremely bearish, but the smoother needs to turn down to confirm a sell signal. The 29 day rate of change, representing the 10-13 week cycle, is below the level from which it turned up in February. Further downside from here may signal downside acceleration but a 10-13 week cycle low is due within the next 1s days. An upturn in the oscillator should be respected as a 10-13 week cycle upturn if you are trading that cycle. Short term centered moving average projections for cycle of 4 to 10-13 weeks are in the 1000-1040 range. As noted the past few days, upturns from a lower trendline break can be sudden and can lead to one of those patented bear shooting rallies. Kaboom. We had it today. However the 13 day cycle upside projection is only 1085 so far. The VIX closed at 23.51, a huge drop from Monday's 26.11. On the inverted scale chart, VIX has moved back to the center of the stool band. The bottom zone begins near the 28 level. The last big short term rally came from the 27-28 area, but a big intermediate rally probably won't come until the index is well below the outer band, i.e. above 30. The blue channel lines are the extension of a linear regression channel from the February and May 2001 highs.
The 5-6 month cycle oscillator is heading down. The 10-13 week cycle could bottom at any time. The oscillator is at the same level that gave rise to the last two intermediate rallies. The short cycle oscillator turned up from the lowest level since early September. The poodits will now be singing the Dover Sole Bounce song. As all stoolies know, there's no such thing as Dover Sole in a bear market.
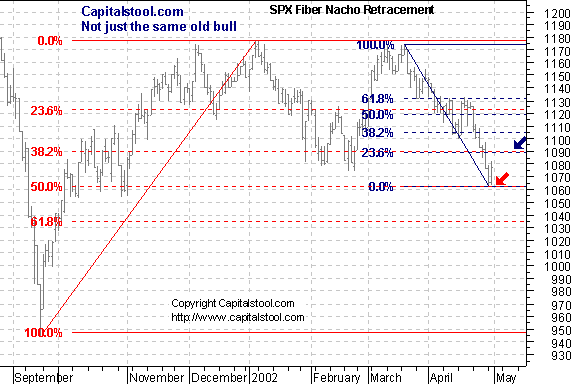
Fibo support held at 1062, a 50% correction of the September-January rally. Resistance is at 1090. IF the low is broken, the next support is at 1035.
The Cycle Conditions tables include cycle phase and a wild guess as to number of periods to the next turn, in days for the shortest cycles, weeks (W) or months (M) for the longer ones. This is a fluid exercise, in other words, the projections are likely to be wrong, but they force us to be vigilant for key turning points, and frequently work well enough to prevent costly misreadings. SPX Cycle Conditions as of 4/30/02
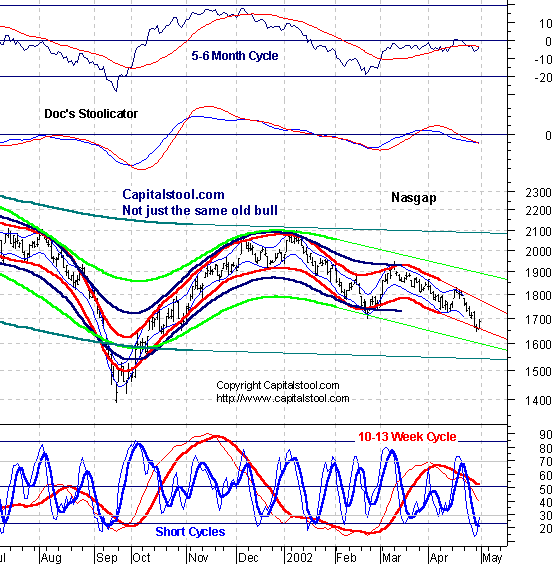
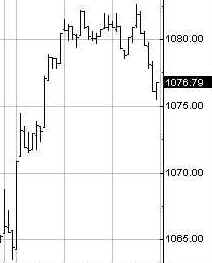
PTT - Periods Till Turn Nasgap Charts The Nas rebounded 31 points, in a return to the scene of the crime rally from the bottom of the short term wave channel. The short cycle oscillator turned up from the lowest level it's been since the bear market began. In spite of the bounce, which we expected, there's no sign of a real bottom. The 5-6 month cycle oscillator also reacted upwards but still appears to be in a topping out process below neutral, usually a sign of impending disaster. That would be negated if the indicator turned positive from here. The 13 day cycle turned up, right on schedule, although it did not reach the most recent centered moving average projected low. With all other cycles still apparently in gear to the downside, the upturn in the 13 is likely to be brief, with projections for longer cycles all 50 to 100 points lower.
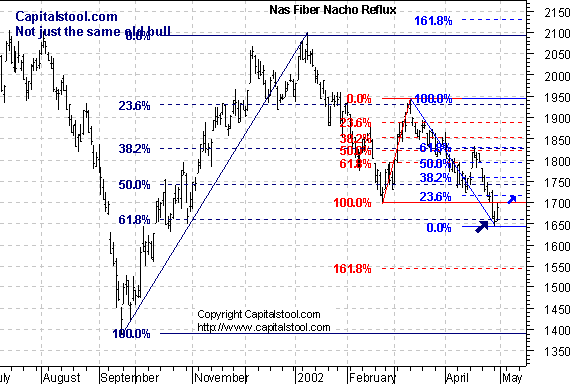
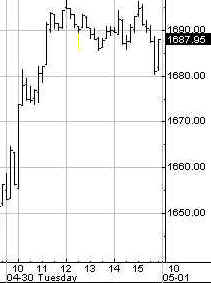
Today was a classic return to the scene of the crime rally as the Nas moved back to the previous support level. Fibo support at 1660 was only slightly broken on Tuesday. Resistance is at 1700 and 1715.
Nasdaq Cycle Conditions as of 4/30/02
PTT
- Periods Till Turn Bonds were up, sending yields
lower. Oscillators are poised for an upturn. If they do so before yield
breaks below 5%, the uptrend is confirmed. In the AM edition. Previous AM edition In the AM edition. Previous AM edition Stock O' The Day- WMS In the AM edition. Previous AM edition If you have an idea for a Stock O', send it to [email protected]. Include some original reason for why you think the stock is deserving. Be clever! Anything longer than 25 words- automatic disqualification! And please, no penny stocks. Feel free to request follow-ups too. Uncle Buck's Illness In the AM edition. Previous AM edition Golden Stool In the AM edition. Previous AM edition
Dr. Stepan N. Stool Let me know what you think on the Stool Pigeons Wire. Previous complete issue with all features Welcome To New Subscribers Welcome, and thank you for subscribing to the Anals of Stock Proctology. You may note some subtle differences in style now that this is no longer a free service. The perspective is still bearish, but it will have a more balanced approach than my message board ravings. You won't see me screaming "BUY" about anything except perhaps gold, but you will see stronger indications of areas and times when I think it might be a good idea to avoid being short. And I promise that I will lose my temper from time to time to keep you entertained! There's also a new feature, Doc's By Request Stock O' The Day. If you have a stock you're interested in, send an email to [email protected], naming the stock, and why you think Doc should look at it, in 25 words or less. 26 words, and you're disqualified! Those that look interesting, Doc will try to feature here within the next day or two. If you have suggestions about other features you'd like to see, send them along to [email protected]. Again, thanks for subscribing!
Explanation of Intraday Commentary-Build charts at http://www.livecharts.com. For custom time bars insert a comma after symbol and number of minutes, e.g. compx,90. This will give you a bar chart of the Nas with 90 minutes per bar. The one day cycle is usually most clear with 8 minute bars and 26/18 stochastics. It varies from day to day. Sometimes 6 minutes works best. Experiment to find the best fit for your trading style, and the market's dominant frequency at the time. The goal here is primarily to monitor the condition of the 8 and 13 day cycles. I typically use 90 minute bars with 26/18 stochastics for the 13 day cycle proxy on the indices during regular trading hours. Other cycles use 26/18 stochastics with the following: 8 days- 60 minute bars On the 24 hour futures charts, use a time per bar approximately 3 to 4 times the above number of minutes, to represent the cycles listed above. ABBREVIATIONS: cma: centered moving average |
![[Most Recent XAU from www.kitco.com]](http://www.weblinks247.com/indexes/idx24_nasdaq_en_2.gif)
![[Most Recent XAU from www.kitco.com]](http://www.weblinks247.com/indexes/idx24_sp500_en_2.gif)
![[Most Recent Quotes from www.kitco.com]](http://kitconet.com/charts/metals/gold/t24_au_en_usoz_2.gif)
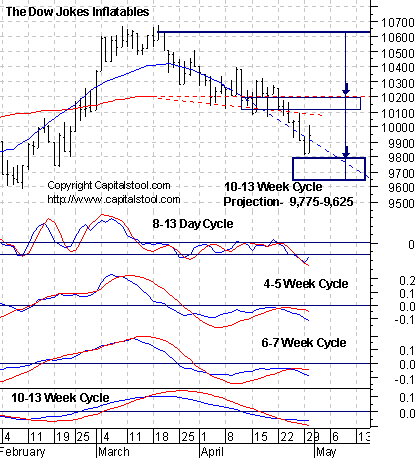
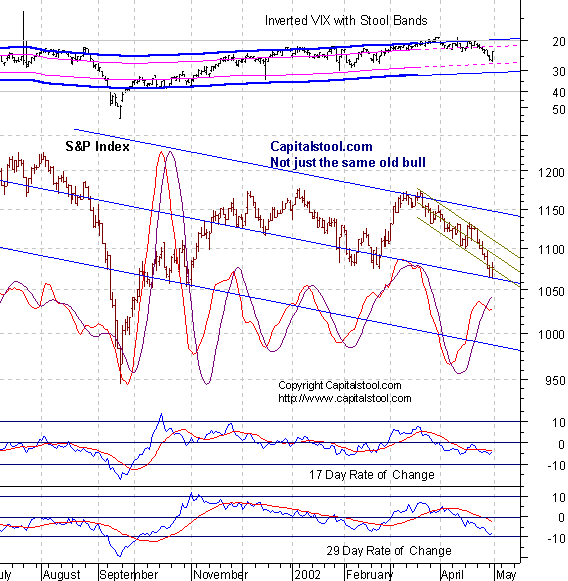
 Chart Powered by METASTOCK