|
10 Minute Bar Charts 4/2/02 Dow Jokes Inflatables
Archives 12/30/01, 1/1/02, 1/2/02, 1/3/02, 1/4/02, 1/7/02, 1/8/02, 1/09/02, 1/10/02, 1/11/02, 1/14/02, 1/15/02, 1/16/02, 1/17/02, 1/18/02, 1/22/02, 1/23/02, 1/24/02, 1/25/02, 1/28/02, 1/29/02, 1/30/02, 1/31/02, 2/1/02, 2/4/02, 2/5/02, 2/06/02, 2/7/02, 2/9/02, 2/11/02, 2/12/02, 2/13/02, 2/14/02, 2/16/02, 2/19/02, 2/20/02, 2/21/02, 2/23/02, 2/25/02, 2/26/02, 2/27/02, 2/28/02, 3/1/02, 3/04/02, 3/05/02, 3/06/02, 3/7/02, 3/10/02,3/11/02, 3/12/02, 3/13/02, 3/14/02, 3/15/02, 3/18/02, 3/19/02, 3/20/02, 3/21/02, 3/22/02, 3/25/02, 3/26/02, 3/28/02, 3/30/02
|
The Anals of Stock ProctologyPublished 5 times
per week by the American Academy of Stock Proctology and Welcome, and thank you for being a founding subscriber to the Anals of Stock Proctology. You may note some subtle differences in style now that this is no longer a free service. The perspective is still bearish, but it will have a more balanced approach than my message board ravings. You' won't see me screaming "BUY" about anything except perhaps gold, but you will see stronger indications of areas and times when I think it might be a good idea to avoid being short. And I promise that I will lose my temper from time to time to keep you entertained! I'll also be adding a new feature, Doc's By Request Stock O' The Day. If you have a stock you're interested in, send an email to [email protected], naming the stock, and why you think I should look at it, in 25 words or less. 26 words, and you're disqualified! Those that look interesting, I'll try to feature here within the next day or two. If you have suggestions about other features you'd like to see, send them along to [email protected]. Again, thanks for subscribing. Now, let me get to work! Not to Worry, It's Sector Specific ( 4/02/02) That's what's Barry Hyman chief market strat-ego-ist at at Ehrenkrantz King Nussbaum said today. Certainly that kind of talk is endemic on Wall Street. Deep down though, you know these guys are nervous. They are all fully invested, and they know all their friends are too, and they're all wondering where the buying is going to come from to keep their portfolios from imploding. So they talk a good game. Wouldn't want the public to panic and screw things up. But it doesn't take selling to send a market down. It only takes just an ever so slight reduction in buying. Just enough to tip those sensitive scales. Because once they start tipping, it does take buying to bring them back. Seems like the only buying these days is from nervous shorts covering in the afternoon, positions they put on in the morning. That's happened often enough in recent weeks that there probably aren't enough of them left to stave off a more serious drop. We'll see. Still, the analcysts continue to churn 'em and burn 'em. By now, you are well aware of the downgrades of Mafiasoft (See below), IBM and a bunch of software outfits, by Golden Sacks. This is new. We are far more accustomed to pump and dump from these folks. And it sure as hell isn't their traders (read market makers) wanting to accumulate this overpriced garbage. No sir. What it tells you is that Golden Sacks, who is also the second largest specialist firm on the NYSE, through their wholly owned subsidiary Spear Leads and Kellogg, is up to something else entirely. You see, they make the market in 400 NYSE stocks. Lo and behold, who do you think is the specialist for IBM? Which IBM you say? Why the one that Golden Sacks downgraded of course! And, lest we forget, Golden Sacks also makes a market in MSFT, and all the other stuff they downgraded, over on the Nas. Now ladies and germs, there can be only one reason and one reason only that they did that. They must be short up the kazoo, short more than they want to carry, and that rally on Monday had to be stopped at all costs. So the floor guys call upstairs to Rick and say, Rick, we're short big here. Can you push the button and get the price down? Nice how that works, isn't it? But more importantly, this is one occasion when you want to be on the same side they are. Because this time, they're right.
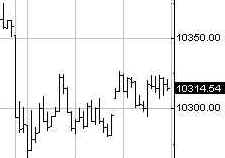
Meanwhile, as Uncle Lou used to say, on the Dow Jokes Inflatable Average, stocks were narrowly lower Tuesday. Just like they were narrowly lower Monday, which is where the Nasdaq would have been Monday if not for the short squeeze. But of course the Nas got back to where it should be, leading the way down. The Dow in that regard is just a subterfuge. The Dow is what they want you to see, not what's really going on. Right now, the picture is mush, but if the Dow drops below 10,250, it will mean that the stage managers have lost control. Once that happens, Katy bar the door. Portfolio Sphincters Index (SPX) and Sentiment The VIX closed at 20.68, up from 20.05 Monday. It remains near its lowest level since August 31, 2000. The SPX dropped 15% in the 6 weeks following that reading, after staying below 20 with the market churning for 2 weeks. This time, the index was at or below 20 for a week and a half and is now moving back up. (Inverted on the chart below) Can we rely on the precedent? The indicator has only "worked" for four years. Four years is not much history. But the ground does seem to be starting to move. The 17 day rate of change, a proxy for the 6-7 week cycle, is headed down, and is now below the zero line. When that happens trends often accelerate. This cycle is due to bottom within 3 to 8 days. The four week cycle bottomed a week ago, but shows no sign of strength. The 29 day rate of change, representing the 10-13 week cycle, remains on the cusp of a sell signal, but as long as it continues to creep higher, the assumption is that the top is not yet complete. A down day tomorrow from this configuration would trigger a strong sell signal.
This is a critical juncture on the cycle chart. Intermediate cycle indicators have begun to turn down at relatively low levels. A downturn from these levels normally indicates severe weakness ahead. The 1 year cycle up phase has been under way since the September 2001 lows, and is now completing a second top. The top building process usually takes weeks. This one has been under way for a month, and with all the cycle juxtaposition, it may stay here for another week or so. Time is on the side of the bears, but based on the position of the short cycle oscillators, a short up phase manifesting as a trading range looks probable.
1135 is a 38.2 % retracement of the prior rally from 1080. The next level to the downside is a retest of the low at 1132, then a 50% retracement of the rally at 1123.
The Cycle Conditions tables include cycle phase and a wild guess as to number of periods to the next turn, in days for the shortest cycles, weeks (W) or months (M) for the longer ones. This is a fluid exercise, in other words, the projections are likely to be wrong, but they force us to be vigilant for key turning points, and frequently work well enough to prevent costly misreadings of the market. SPX Cycle Conditions as of 4/2/02
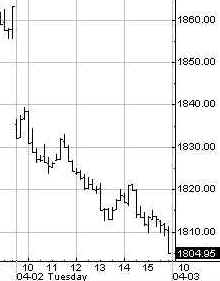
PTT - Periods Till Turn Nasgap Charts The short cycle oscillator has been rising for a week and the Nas has been range bound. That's what I call a SWUP or sideways up phase. The market range rattles while the cycle oscillator moves up. This generally indicates deteriorating psychology and demand, and is normally followed by a sharp move down. What it's actually telling you is that the relative slope of the move is positive versus bigger waves that contains it, but not positive enough to turn the bigger wave up in absolute terms. The six month cycle oscillator remains weak in negative territory, and precariously close to a sell signal. This also indicates a weak up phase, and it will be a precursor to complete collapse if the indicator drops from here. Obviously there are a few "ifs" in there, and its best to wait for a definitive signal. Another bounce off the 1800 area would not surprise, nor would it change anything. A breakdown is coming.
The next fib levels going down are 1790 and 1772. Then all the way down to near 1700.
Nasdaq Cycle Conditions as of 4/2/02
PTT
- Periods Till Turn Sucktor Watch- XOI The energy
sector is overextended, but it has come out of a tremendous base, and
short cycles are just turning up again. When a group that typically
cycles, starts trending, well then, it's trending. Tuesday will be a
pivotal day. Another up day and the group is almost certainly trending,
while a little selloff would signal an intermediate top. Since I once
heard that, "The trend is your friend," my bet is on this
continuing. Definitely bad for the rest of the market. Stoolwethers- Mafiasoft I have been bearish on this stock for a long, long time. Why? First, because it's a monopoly, their products are lousy, and everybody in the tech world hates them, and naturally every institution in the world is stuffed to the gills with it. Who they gonna sell it to? This has nowhere to go but down. Second, because this company is the world's largest criminal organization, and their are some judges and attorneys general who can't be co-opted and corrupted. But hey, I'm just a chartist. What do I know? Heah come da judge!
Department of Yes We Have No Inflation This is the Goldman Sucks Total Return Commodity Index. Can you tell which way it's headed. OK, class, all together now- Ohhhh,
Yes we have no inflation Golden Stool Ah the gold stocks! Measures of the 10-13 week cycle are early in the up phase. Short cycles are toppy and need to consolidate however. That could be just a sideways move. This still looks like a very powerful intermediate up phase, in the early stages of a long term secular bull market in gold. Up around the 110 level might be a time to take profits, but I'm inclined to hold and see how it acts if and when it gets there.
Oops, uncertainty rears its ugly head. The short cycle is coming into a low over the next few days, and the intermediate wave is up. The next day or two will be crucial in determining the slope of the intermediate uptrend. Each time yields approach 5.50, "the invisible hand" starts buying, capping the move. Whether the trend is strong enough now to break that guy's hand is the big question. The negative divergences need to be watched. If the momentum indicators turn down from these levels, yields could head down back to the 5% area. This needs to be watched closely.
Uncle Buck's Illness Just about the time you think old Uncle Buck is ready to buy the farm, he sits up in bed again. He'll probably fall down to 117 in the short run, but based on the intermediate cycle oscillator, the big breakdown might still be a few weeks away. Still, tell the family to stay near the phone.
See you in Intraday Stool. Dr. Stepan N. Stool Let me know what you think on the Stool Pigeons Wire.
|

![[Most Recent XAU from www.kitco.com]](http://www.weblinks247.com/indexes/idx24_nasdaq_en_2.gif)
![[Most Recent XAU from www.kitco.com]](http://www.weblinks247.com/indexes/idx24_sp500_en_2.gif)
![[Most Recent Quotes from www.kitco.com]](http://kitconet.com/charts/metals/gold/t24_au_en_usoz_2.gif)
 Chart Powered by METASTOCK