|
10 Minute Bar Charts 4/15/02 Dow Jokes Inflatables
Archives 12/30/01, 1/1/02, 1/2/02, 1/3/02, 1/4/02, 1/7/02, 1/8/02, 1/09/02, 1/10/02, 1/11/02, 1/14/02, 1/15/02, 1/16/02, 1/17/02, 1/18/02, 1/22/02, 1/23/02, 1/24/02, 1/25/02, 1/28/02, 1/29/02, 1/30/02, 1/31/02, 2/1/02, 2/4/02, 2/5/02, 2/06/02, 2/7/02, 2/9/02, 2/11/02, 2/12/02, 2/13/02, 2/14/02, 2/16/02, 2/19/02, 2/20/02, 2/21/02, 2/23/02, 2/25/02, 2/26/02, 2/27/02, 2/28/02, 3/1/02, 3/04/02, 3/05/02, 3/06/02, 3/7/02, 3/10/02,3/11/02, 3/12/02, 3/13/02, 3/14/02, 3/15/02, 3/18/02, 3/19/02, 3/20/02, 3/21/02, 3/22/02, 3/25/02, 3/26/02, 3/28/02, 3/30/02 4/1/02, 4/2/02, 4/3/02, 4/4/02, 4/6/02, 4/8/02, 4/9/02, 4/10/02, 4/11/02, 4/13/02
|
The Anals of Stock ProctologyPublished 5 times
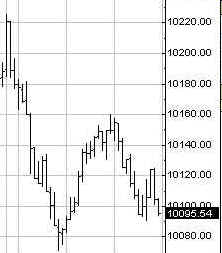
per week by the American Academy of Stock Proctology and Bitching and Moaning Stage (4/15/02) Most people were too busy stuffing envelopes for Uncle Sam today to pay much attention to the market. But holders of GE, Citicrap, and WalFart certainly noticed, as these stocks got ponded, GE for the third day in a row. The meltdown led GE's Jeff I'mmelting to hijack 18 minutes of airtime at 6 PM NY time, from the GE infomercial channel, better known to Stoolies as Proctovision. All we heard was 18 minutes of repetitious whining. The guy repeated himself about once every two minutes about how the market doesn't get it, and GE is number 1 in this and number 1 in that, and has a Triple A credit rating, and please, please buy my stock. And if you don't buy my stock I'll break your kneecaps. Methinks the man doth protest too much, although after this barrage the market should have a knee jerk reaction tomorrow. But what it will be? For bears, it was a truly disgusting display. There may be some on the Street who share that view. I'm melting's performance may just unnerve and loosen a few portfolio sphincters into more excessive dumping. After this pounding to the biggest holding of most of the world's leading institutions, it will be interesting to see how long they can hold it in. No fewer than 10 institutions hold at least 100 million shares of GE, with number 1 being Barclays Group with 338 million shares and number 10 being, what's this, why it's GE with 100 million shares. No wonder they're moaning. $500 million, a billion and a half down the drain in a single portfolio in 3 days ain't chump change. Meanwhile, have a look at the chart. What happened to all that giddy bullishness we saw back in March? The unanimously bullish chorus heard from the Street last month has suddenly grown into a cast of shrill whiners. They've gone from irrational exuberance to irrational bitching and moaning, complaining how investors are missing how great things are, and how stupid they are for selling first and asking questions later. I hate to point out to them, there ain't that much selling. Buyers are just tapped out, and there's just less buying. In other words, no more fools. Until we see a true selling surge and a significant shift in the Street's psychology from exuberance, to complacency to carping to outright bearishness, this thing is just going to continue drifting and chopping lower.
The stage managers have clearly lost control of the Dow and the S&P, which is why portfolio sphincters are suddenly sounding like they all lost an important body part. When GE and IBM and C start dropping like stones, that's a humongous loss of portfolio power. The Dow is supposed to have been in a 6-7 week cycle up phase for two weeks now, and it keeps drifting lower. What happens when that up phase ends? KABOOM. It doesn't look like the time for that has quite arrived. The spiking, flopping, and drifting is probably going to continue for a bit longer. Portfolio Sphincters Index (SPX) and Sentiment The VIX closed at 22.38, up from 22.09 Thursday. Low volatility complacency rules, and as long as it does, this down-up-down grind can continue indefinitely. On the inverted scale chart, VIX has finally dropped below the top band, signaling the beginning of a big decline in stock prices. The last short term rally came from the 27-28 area. At the rate we're going it will take weeks to get even there, and a good intermediate rally probably won't come until the index is well above 30. The 17 day rate of change, a proxy for the 6-7 week cycle, still hasn't turned up, but the 6-7 week cycle oscillator superimposed on the chart has. These signals can be a little early or a little late, but a bump up from somewhere around here in the next week is probable. On the other hand, watch out for an early downturn in this indicator. An early downturn from low levels is usually a sign of devastating weakness. The 29 day rate of change, representing the 10-13 week cycle, is now definitely heading down, breaking out of the top pattern it's been in for weeks. This should limit any upturn in the 6-7 week cycle. The blue channel lines are the extension of a linear regression channel from the February and May 2001 highs.
The 5-6 month and 10-13 week cycle indicators are still weakening from low starting levels. This normally suggests extended, severe weakness. So far the severe part hasn't materialized. The Chinese water torture decline is likely to continue.
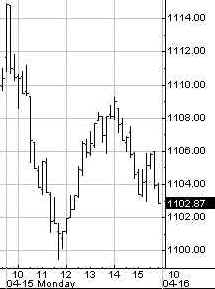
1100 is a round number but only minor support in fibo terms. Maybe we'll see a 1100-1112 trading range for a couple of days.
The Cycle Conditions tables include cycle phase and a wild guess as to number of periods to the next turn, in days for the shortest cycles, weeks (W) or months (M) for the longer ones. This is a fluid exercise, in other words, the projections are likely to be wrong, but they force us to be vigilant for key turning points, and frequently work well enough to prevent costly misreadings of the market. SPX Cycle Conditions as of 4/15/02
PTT - Periods Till Turn Nasgap Charts The 10-13 week cycle is in a downturn, with the 5-6 month cycle in a weak up phase, the quintessential SWUP, or sideways up phase. The indicator keeps flirting with a breakdown, but positive cyclicality is still just strong enough to prevent it. The 6-7 week cycle has finally turned up, but it won't get very far considering the weakness in longer cycles and the relative stinginess of the Feed.
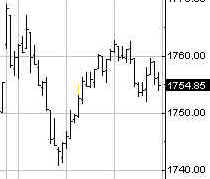
Heading down, 1699 is a 100% retracement of the February-March rally. Last weeks low will also be tested. The first upside retracement level is 1777 if this SOX earnings rally can get legs.
Nasdaq Cycle Conditions as of 4/15/02
PTT
- Periods Till Turn Sucktor Watch- Energy The XOI
retraced 50% of the recent rally and bounced. But the cycle indicators
haven't signaled a low yet. If this is it the stocks need to do some work
around these levels before staging a significant rally. Dirty Dirty SOX Hate to keep
repeating this, but the dirty dirty SOX could still result in stained
shorts. yesterday's rally flashed short cycle low signals right on the
seven month long uptrend line. Too many shorts are fodder for the bulls and market
makers. And toninght TXN beats by a penny and Novellus only lost $.02
instead of $.09, all excuses, but all the market needs to jam itself right
up the shorts' petoots. Stool Request Line Stock O' The Day - CYMI This one was sent in last week by stoolie Nick, who thinks the stock is going up more. Nick might be right. The stock is in a sideways down phase. Cycle indicators are in a down phase, but the stock continues to hold up. Looks like the stock may try to launch from the trend support again. But at the moment, all of the cycle indicators are on sell signals. Conflicting signs make this a toss-up. So I'll take a wild guess. No breakout, and a 45-50 trading range....till kling-on come. What is it with all these bullish charts sent in for Stock 'O?
I still have a few Stock'O's in the queue, but if you have an idea for one, send it to [email protected]. Include some original reason for why you think the stock is deserving. Be clever! Anything longer than 25 words- automatic disqualification! And please, no penny stocks. Stoolwethers- The General- Not Again!!!! Did you see
the GE telethon on Proctovision tonight (Monday)? What a disgusting
display of panicky, shrill, self-promotion. Sue Herass lobbed a series of
softballs at GE Chairman Jeffrey I'mmelting, and he just kept yelling
about GE being number 1 in this and that, and the triple A credit rating.
Now, I ask you ladies and germs. Whom do you trust, the shills on a corporate
infomercial, or the charts? OK, so it's getting close to a low, and might
be good for a snapback, so I wouldn't short it here, and I sure as hell
wouldn't buy it until it successfully tested support, if then.. Where this
smoke, there's fire, and this baby's smoldering. Golden Stool Gold stocks continued their sideways move as cycle indicators began correcting. If the indicators remain at high levels, it's safe to conclude that the group is trending, and so long as the trend is intact, they can be held. The expectation here is still for a shallow correction like the last one. Doc continues to be a holder of precious metals funds until he sees clear and unmistakable signs of reversal.
Long term
bond yields have been correcting for a couple of weeks. The moment of
truth has arrived, with yields back to the uptrend line. They ticked below
it on Monday. If short cycle
oscillators do not turn up with yields beginning to move up off the
trendline it may be signaling severe economic weakness. Bond yields have tended to cycle every 4 to 6 weeks.
They're due to turn up, but that turn remains elusive. Uncle Buck's Illness Every
time Uncle Buck looks like he'll finally keel over, he comes back from the
dead. Looks like time for this up phase to kick into high gear but the 119
level may be impregnable. See you in Intraday Stool. Dr. Stepan N. Stool Let me know what you think on the Stool Pigeons Wire. Welcome To New Subscribers Welcome, and thank you for subscribing to the Anals of Stock Proctology. You may note some subtle differences in style now that this is no longer a free service. The perspective is still bearish, but it will have a more balanced approach than my message board ravings. You' won't see me screaming "BUY" about anything except perhaps gold, but you will see stronger indications of areas and times when I think it might be a good idea to avoid being short. And I promise that I will lose my temper from time to time to keep you entertained! I'll also be adding a new feature, Doc's By Request Stock O' The Day. If you have a stock you're interested in, send an email to [email protected], naming the stock, and why you think I should look at it, in 25 words or less. 26 words, and you're disqualified! Those that look interesting, I'll try to feature here within the next day or two. If you have suggestions about other features you'd like to see, send them along to [email protected]. Again, thanks for subscribing. Now, let me get to work!
|
![[Most Recent XAU from www.kitco.com]](http://www.weblinks247.com/indexes/idx24_nasdaq_en_2.gif)
![[Most Recent XAU from www.kitco.com]](http://www.weblinks247.com/indexes/idx24_sp500_en_2.gif)
![[Most Recent Quotes from www.kitco.com]](http://kitconet.com/charts/metals/gold/t24_au_en_usoz_2.gif)
 Chart Powered by METASTOCK