|
10 Minute Bar Charts 4/16/02 Dow Jokes Inflatables
Archives 12/30/01, 1/1/02, 1/2/02, 1/3/02, 1/4/02, 1/7/02, 1/8/02, 1/09/02, 1/10/02, 1/11/02, 1/14/02, 1/15/02, 1/16/02, 1/17/02, 1/18/02, 1/22/02, 1/23/02, 1/24/02, 1/25/02, 1/28/02, 1/29/02, 1/30/02, 1/31/02, 2/1/02, 2/4/02, 2/5/02, 2/06/02, 2/7/02, 2/9/02, 2/11/02, 2/12/02, 2/13/02, 2/14/02, 2/16/02, 2/19/02, 2/20/02, 2/21/02, 2/23/02, 2/25/02, 2/26/02, 2/27/02, 2/28/02, 3/1/02, 3/04/02, 3/05/02, 3/06/02, 3/7/02, 3/10/02,3/11/02, 3/12/02, 3/13/02, 3/14/02, 3/15/02, 3/18/02, 3/19/02, 3/20/02, 3/21/02, 3/22/02, 3/25/02, 3/26/02, 3/28/02, 3/30/02 4/1/02, 4/2/02, 4/3/02, 4/4/02, 4/6/02, 4/8/02, 4/9/02, 4/10/02, 4/11/02, 4/13/02, 4/15/02, 4/16/02
|
The Anals of Stock ProctologyPublished 5 times
per week by the American Academy of Stock Proctology and Get used to it ladies and germs. There's no sign that this endless trading range is going to end anytime soon. This is, of course, because the market is a perfectly rational discounting mechanism, and all risk has been offloaded into derivatives. Therefore there is no reason for the market to fluctuate or move. Why, if it weren't for the damn speculators, the market stage managers could just get up Monday morning, have a meeting at 8:30, and set the price for the week, increasing it 1/10 of one percent every week. But those damn short sellers keep screwing things up. First they load up short, stopping rallies cold, then as soon as there's a little news, good or bad, it doesn't matter, they cover, driving prices up. This drives the portfolio sphincters crazy because they get scared they're missing something, so then they have to get up off their assess and actually make a decision. Of course it's always a knee jerk reaction, and by definition wrong, but that doesn't matter either, as long as they don't lose more money than the guy in the next building over. This is how it works, isn't it? OK, ok, all seriousness aside, we have indicators going every which way, and continuing cycle juxtaposition. Until a couple of those cycles get in gear in the same direction, we have to be content with being driven crazy. And there's no sign that those cycles will get in gear in the near term. Right now the key 6-7 week trading cycle is up, but the 10-13 week cycle hasn't bottomed yet. Looking out a couple of weeks it's possible, even likely, that the 10-13 week cycle will be headed up while the 6-7 is headed down and the 5-6 month cycle isn't finished topping out. What this market needs is a good old fashioned catalyst, like a giant surprise bankruptcy. What the hell, they'd probably ignore even that. If the cycles are flat, then flat it is, and flat it shall be. One of the poodits, Dr. Stool doesn't remember which one, actually said something intelligent the other day. "The market is in a powerful trend. The only problem is, it's sideways."
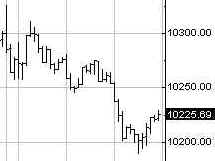
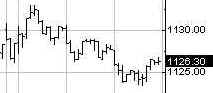
The Dow Inflatables were bled a little Wednesday, remaining within a well defined but shallow downtrend. The 10-13 week cycle projection didn't move, remaining at just below 10,000. The time for the 10-13 week cycle low is growing near. The 4-5 week and 6-7 week cycles may be merging, and appear to be in a sideways up phase, or range. The cycle oscillators still indicate an up phase, but the effective direction has been flat, and there 's no reason for that to change. If the short cycle indicators turn down before the 10-13 week cycle indicator turns up, we'll see a brief selloff that should mark the cycle low. But let's just follow the indicators, and not anticipate. Portfolio Sphincters Index (SPX) and Sentiment The VIX closed at 20.18 , down a bit from 20.3 the day before. Low option volatility complacency continues, and as long as it does, this down-up-down grind can continue indefinitely. On the inverted scale chart, VIX is back in the top signal band, which means the rally probably isn't sustainable. The last big short term rally came from the 27-28 area. At this rate it will take weeks to get there, and a big intermediate swing rally probably won't come until the index is well above 30. The 17 day rate of change, a proxy for the 6-7 week cycle, finally turned up, barely. The 6-7 week cycle oscillator superimposed on the chart gave an early buy signal last week and continues to rise. These signals can be a little early or a little late, but this one gave plenty of warning that a rally was on the way. Now we need to watch for an early downturn in the indicator. The 29 day rate of change, representing the 10-13 week cycle, is pausing but still negative overall.. The 10-13 week cycle down phase should limit the size of the upturn in the 6-7 week cycle, unless the 29 day rate of change also turns up. Hypothetical at this point but, as always, needs to be watched. The blue channel lines are the extension of a linear regression channel from the February and May 2001 highs.
The rally hasn't changed the configuration of any of the cycle oscillators. If this is more than a brief counter trend rally, the indicators aren't telling us yet. The index is locked on the 7 month trendline. Conflicting cyclicality means the market will go nowhere fast. Tough on traders of all stripes, and especially tough on those who write about it daily. Get me outta here already!
The rally ran up to the 38.2% fiber nacho reflux point and stopped. 1137 would be a 50% retracement.
The Cycle Conditions tables include cycle phase and a wild guess as to number of periods to the next turn, in days for the shortest cycles, weeks (W) or months (M) for the longer ones. This is a fluid exercise, in other words, the projections are likely to be wrong, but they force us to be vigilant for key turning points, and frequently work well enough to prevent costly misreadings. SPX Cycle Conditions as of 4/17/02
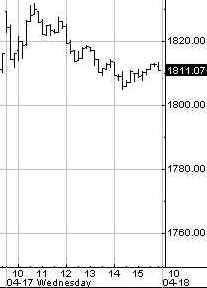
PTT - Periods Till Turn Nasgap Charts This looks like a classic return to the scene of the crime, where the market first breaks a key support level or trendline, generating a lot of technical selling. The market makers get loaded up long, and the market "magically" rallies back to the breakdown line a week or so later. This is the 6-7 week cycle up phase. The action of the 5-6 month cycle oscillator now makes it look like that cycle is still in the throes of a dull sideways up phase that may last another month or two. Ugh. Wake me up when it's over. But if we hate it, think how the Street feels. The borkers are dieing a slow death. The short cycle oscillator is up in a top zone. On the other hand the unnamed double secret oscillator is on the cusp of a buy signal. It wouldn't dare, would it?
Yesterday Doc said, "Perhaps the 1810 level will have a magnetic attraction." Nice guess! Next resistance level is still 1835.
Nasdaq Cycle Conditions as of 4/17/02
PTT
- Periods Till Turn Sucktor Watch Dirty Dirty SOX The dirty
dirty SOX spin cycle rally continued into day 2, but without conviction.
The little upticks in the oscillators do not impress Dr. Stool. Looks like
plenty of sellers waiting above 615. In other words, resistance. If the
10-13 week cycle oscillators managed to turn up over the next few days,
then I'd worry, but lets cross that bridge only when and if we get there. Stool Request Line Stock O' The Day - Stock O' is taking the night off. I still have a few Stock'O's in the queue, but if you have an idea for one, send it to [email protected]. Include some original reason for why you think the stock is deserving. Be clever! Anything longer than 25 words- automatic disqualification! And please, no penny stocks. Stoolwethers- IBM, You BM, We All BM IBM reported
after the bell. The market action is shown on the chart in red. The
sphincters were buying, or maybe that was the shorts covering. The stock's
Dover Sole, no secret there, but there's no sign of a meaningful rally. An
awful lot of people are praying for TheirBM get back to 90. They should be
so lucky. Golden Stool This is really interesting. The gold stock index is moving sideways as the cycle oscillators correct. This is a sideways down phase, often the precursor to a sharp up move. It's possible the index could breakout above the centered long term linear regression projection and move into the top half of the channel projection. It also might just make a double top at 105 and continue correcting for awhile. If it does break out, it's the real thing.
We're
seeing conflicting indications here. On the one hand there are indications
of an intermediate top, and on the other hand, a short term low. The
uptrend is still intact and a short cycle upturn is due. The strength of
that, or lack thereof, will tell us how much inflation expectations are
building. How much you wanna bet the Greenie got it wrong? My bet
would be that yields take off again. The long end of the market began
selling off as soon as his comments that the Fed wasn't anxious to raise
rates hit the wires. We also saw upticks in energy and industrial
commodities. With the index sitting on the trendline, what happens next is
extremely important to the longer term outlook, not just for bonds, but
for everything. The sphincters refuse to sell as long as the denominator
on that income capitalization formula stays low. Uncle Buck's Illness Uh oh.
Did Uncle Buck bite the big one with that 116.60 close? It sure finally
looks like it, but he's made miraculous comebacks before, so let's
withhold judgment for one more day. He doesn't look so good here in night
trading, now at 116.44 Family, be ready! See you in Intraday Stool. Dr. Stepan N. Stool Let me know what you think on the Stool Pigeons Wire. Welcome To New Subscribers Welcome, and thank you for subscribing to the Anals of Stock Proctology. You may note some subtle differences in style now that this is no longer a free service. The perspective is still bearish, but it will have a more balanced approach than my message board ravings. You won't see me screaming "BUY" about anything except perhaps gold, but you will see stronger indications of areas and times when I think it might be a good idea to avoid being short. And I promise that I will lose my temper from time to time to keep you entertained! There's also a new feature, Doc's By Request Stock O' The Day. If you have a stock you're interested in, send an email to [email protected], naming the stock, and why you think Doc should look at it, in 25 words or less. 26 words, and you're disqualified! Those that look interesting, Doc will try to feature here within the next day or two. If you have suggestions about other features you'd like to see, send them along to [email protected]. Again, thanks for subscribing!
|
![[Most Recent XAU from www.kitco.com]](http://www.weblinks247.com/indexes/idx24_nasdaq_en_2.gif)
![[Most Recent XAU from www.kitco.com]](http://www.weblinks247.com/indexes/idx24_sp500_en_2.gif)
![[Most Recent Quotes from www.kitco.com]](http://kitconet.com/charts/metals/gold/t24_au_en_usoz_2.gif)
 Chart Powered by METASTOCK