|
10 Minute Bar Charts 4/19/02 Dow Jokes Inflatables
Archives 12/30/01, 1/1/02, 1/2/02, 1/3/02, 1/4/02, 1/7/02, 1/8/02, 1/09/02, 1/10/02, 1/11/02, 1/14/02, 1/15/02, 1/16/02, 1/17/02, 1/18/02, 1/22/02, 1/23/02, 1/24/02, 1/25/02, 1/28/02, 1/29/02, 1/30/02, 1/31/02, 2/1/02, 2/4/02, 2/5/02, 2/06/02, 2/7/02, 2/9/02, 2/11/02, 2/12/02, 2/13/02, 2/14/02, 2/16/02, 2/19/02, 2/20/02, 2/21/02, 2/23/02, 2/25/02, 2/26/02, 2/27/02, 2/28/02, 3/1/02, 3/04/02, 3/05/02, 3/06/02, 3/7/02, 3/10/02,3/11/02, 3/12/02, 3/13/02, 3/14/02, 3/15/02, 3/18/02, 3/19/02, 3/20/02, 3/21/02, 3/22/02, 3/25/02, 3/26/02, 3/28/02, 3/30/02 4/1/02, 4/2/02, 4/3/02, 4/4/02, 4/6/02, 4/8/02, 4/9/02, 4/10/02, 4/11/02, 4/13/02, 4/15/02, 4/16/02, 4/17/02, 4/18/02
|
The Anals of Stock ProctologyPublished 5 times
per week by the American Academy of Stock Proctology and Countdown To Meltdown (4/20/02)
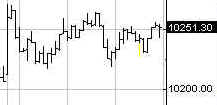
The Dow had a bit of an uptick Friday, but it remains well contained within a linear regression channel dating back to early March. The cycle indicators are mixed, with the 10-13 week cycle on the cusp of a possible upturn and the 6-7 week and 4-5 week cycles due to top out very soon. This also looks like an 8 day cycle high. Monday and Tuesday will go a long way toward telling whether cyclicality will continue to be working in opposite directions, or whether the time has come for things to get in gear, either up or down. An authoritative downturn would signal that the 10-13 week cycle remains down while the other short term cycles are getting in gear with it. That condition could last 2-3 weeks. On the other hand, a rally would be likely to lead to more choppy sideways action for 2-4 weeks, with the 10-13 week cycle up phase working against downturns in the 6-7 and 4-5 week cycles. The first scenario seems the more likely, but let's let the market tell the story. The Fed was docile again on
Friday, doing a $3 billion weekend repo, and a $1.366 billion coupon pass.
Thursday's activity included a $4 billion, 28 day repo and a $6 billion
overnight repo which replaced $10.9 billion in maturing permanent paper.
Friday's addition of $4.4 billion is actually another net drain,
because it fell short of refunding Thursday's $6 billion overnighter. Thursday's
charts show the picture of a dramatic change in monetary processes
over the past month which we need to keep an eye on, as they should
indicate weakness in both the markets and the economy. The charts below
show changes in narrow and broad money as a result. The drop in M1 is the
biggest in 2 years and this is the first time in that period that we have
seen simultaneously declines in both M1 and M3. It looks like the gas is
coming out of the credit bubble, and that is not good news for the
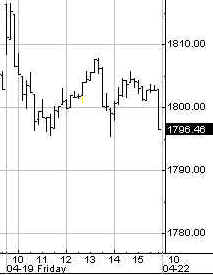
markets. The theory has been that the economy has not been creating enough liquidity for the stock market to turn up broadly, or on a sustained basis, and that without the mortgage credit bubble mechanics we saw operating in the fourth quarter, the market must decline. The refi bulge, which created the liquidity that caused the stock market rally and the economic non-recovery blip, has subsided, and for whatever reason the Fed, if not tapping the brakes, at least doesn't have its foot on the gas. Without that support stock prices should decline across the board very soon, if the theory is correct. Doug Noland's Credit Bubble Bulletin is required reading for Doc each week. Noland's insights are compelling. Something he wrote this week especially caught my attention because of its implications for the stock market. Noland was discussing how the major banks always chase the hot trend. Doc has had fun about this, in particular with our friends at FleetEnemaBoston, who bought the third largest NYSE Specialist firm, Meehan, just as the bear market was beginning, in perhaps the greatest self bork of all time. How freaking dumb can the buyer be, if the Specialist firm is willing to sell itself to you. Those guys had only been in the business a couple hundred years. Why were they willing to sell out? You think they didn't know what was coming? Obviously Fleet wasn't too fleet in the head on this deal. Fleet had also bought Robbie Stevens at the top of the bubble. It is a miracle that bankers ever make any money, but then when the Fed is your partner, it's not too hard. Noland was pointing out how the major banks make these acquisitions at what they see as opportunistic times, while Doc thinks it should be taken as a contrary indicator. What Noland was showing that all the big boys are now chasing the mortgage business. But as Doc has been documenting here, that horse got out of the barn last year, and ran so hard, it dropped dead in the last month. Noland's most interesting and important point may be that "Almost across the board, we note that banks are now looking to pare back “principal investing,” equity underwriting." Doc had accidentally come upon exactly the same statement in the annual report of UBS, Union Bank of Switzerland, one of the worlds richest financial institutions, and owner of UBS Whoreburg Paine Webber. That statement indicated that as a result of losses in capital market activities and direct investing, all of which is a euphemism for "market making" or "trading" activities, they were in the process of reducing their commitments and winding down those operations. They intend to get out of the business! If, as Noland says, he saw the similar statements in the financial statements of other major banks, the implications for the market are huge. If these enormous players are in the process of withdrawing their capital from the markets, that means less volume, and less market depth, and less buying. Combined with the reduction of Fed support, direct or indirect, it is hard to imagine a scenario which doesn't include falling stock prices. Sure they can push the jello around on the plate, and rally one group or another for a few months, while selling off others, but on balance, prices should fall. Portfolio Sphincters Index (SPX) and Sentiment The SPX was virtually unchanged Friday. The 17 day rate of change, a proxy for the 6-7 week cycle, stalled after beginning to head weakly higher earlier in the week. The 6-7 week cycle oscillator superimposed on the chart gave an early buy signal and continues to rise. Now we need to watch for an early downturn in the indicator. The short term linear regression channel still suggests a tightly defined downtrend. The 29 day rate of change, representing the 10-13 week cycle, is pausing, but still negative overall. The 10-13 week cycle down phase should continue to limit the size of the upturn in the 6-7 week cycle, unless the 29 day rate of change also turns up. It seems unlikely in view of the lack of monetary support. The VIX closed at 20.3, down from 21.24 the day before. Low option volatility continues, and as long as it does, this down-up-down grind can continue indefinitely. On the inverted scale chart, VIX remains in the top band, indicating that a big decline should lie ahead, if we can rely on the history of the last four years. The last big short term rally came from the 27-28 area. At this rate it will take weeks to get there, and a big intermediate swing rally probably won't come until the index is well above 30. The blue channel lines are the extension of a linear regression channel from the February and May 2001 highs.
The cycle picture remains mixed, with the SPX locked between support at 1100 and resistance at 1130 along the 7 month trendline. The market does not have the strength to go higher, and the fact that it's unable to move strongly off key support suggests that a breakdown is out there. But when? From a cyclic standpoint there are two probable time periods, now, or June. The short cycle oscillator is in the sell zone, so maybe it's now.
Minor fibo support levels are 1117 and 1112. Failing that we'll see a retest of 1100. Resistance is 1128 and 1136.
The long term chart of the SPX continues to show it skirting the upper edge of the long term cycle downtrend channels. The long term linear regression slops suggest there's no basis for Wall Street's bullishness.
The Cycle Conditions tables include cycle phase and a wild guess as to number of periods to the next turn, in days for the shortest cycles, weeks (W) or months (M) for the longer ones. This is a fluid exercise, in other words, the projections are likely to be wrong, but they force us to be vigilant for key turning points, and frequently work well enough to prevent costly misreadings. SPX Cycle Conditions as of 4/19/02
PTT - Periods Till Turn Nasgap Charts The Nas approached the underside of the uptrend line it broke, as well as the top of the cycle channel and ran out of gas last week. This is the 6-7 week cycle up phase. The 5-6 month cycle is either in the throes of a dull sideways up phase that may last another month or a top that could break down at any time. We won't know until there's a better signal. The 10-13 week cycle oscillator is still topping. The short cycle oscillator is up in a top zone and has begun to turn down, with the index bumping the top of a descending 5-6 month cycle wave band. A down day Monday would be the beginning of the end. Or the trading range may just persist forever and ever now that the perfect discounting mechanism of the market has reached perfect equilibrium, and there's no instability in the world. Cycle counts, however, suggest that the downturn is due within a day or two.
On the way down, minor fibo support levels are at 1778 and 1765. Resistance is at 1836.
The 12-18 month cycle remains locked along the upper long term cycle channel band. If the market doesn't break down soon, then the slope of that channel is less negative.
Nasdaq Cycle Conditions as of 4/19/02
PTT
- Periods Till Turn Sucktor Watch- Dirty Dirty SOX The weekly chart of the Dirty Dirty SOX shows an intact long term cycle downtrend making a one year cycle top.
Stool Request Line Stock O' The Day - QLGC This is a double request from our good buddy K Wave, and from a new stoolie, Al. Thanks to both. The problem with this stock, like so many other tech stocks, is that everyone is shorting it on the basis of funny mentals, which suck, and the entire world knows it. The chart is a classic example of cycle juxtaposition. The question of when it's going to break down can't be answered, yet. The indicators are getting in gear to give concurrent sell signals, but they haven't so we have to wait. Once they do, the stock should fall, but how much? The problem is our old bugaboo, too high short interest. As of March 15, the short interest was 10.5 million shares. Institutions held 70 million out of a total of 93 million shares. Nearly 12% of the stock is held short, equivalent to almost half the number of shares in non-institutional hands. From mid February to mid March, institutions unloaded 5.7 million more shares than they bought, yet the stock went up 25%. Until something triggers institutions to sell the stock heavily, it will be resistant to decline. There's just more demand for the stock from short sellers covering, than there is available supply.
I still have a few Stock'O's in the queue, but if you have an idea for one, send it to [email protected]. Include some original reason for why you think the stock is deserving. Be clever! Anything longer than 25 words- automatic disqualification! And please, no penny stocks. Stoolwethers- World's Largest Criminal Organization Nothing like
a long term chart to give perspective. Look at that enormous triangle.
You're looking at a 32 dollar stock by this time next year if the bottom
of that triangle doesn't hold. The breakdown could come now, or after a
period of consolidation along the support line. Golden Stool Gold has
been consolidating its gains for 11 weeks, during which time the
intermediate cycle has been in a down phase. That phase could end after a continuation
of the sideways movement or with a pullback to the 290 area. Either way,
an upside breakout should follow. The long
term chart of bond yields says they're still uptrending, but at a critical
point. Will the uptrend in yields accelerate off the trendline or
consolidate around current levels for many months. The alternative of a
downturn does not appear to be in the cards. Uncle Buck's Illness Here's Uncle Buck on a weekly chart. He's headed lower in the next few months, to at least the 112-113 area. The descending highs in long term mo suggest increasing weakness but it's too early to say of this reverses the long term uptrend.
See you in Intraday Stool. Dr. Stepan N. Stool Let me know what you think on the Stool Pigeons Wire. Welcome To New Subscribers Welcome, and thank you for subscribing to the Anals of Stock Proctology. You may note some subtle differences in style now that this is no longer a free service. The perspective is still bearish, but it will have a more balanced approach than my message board ravings. You won't see me screaming "BUY" about anything except perhaps gold, but you will see stronger indications of areas and times when I think it might be a good idea to avoid being short. And I promise that I will lose my temper from time to time to keep you entertained! There's also a new feature, Doc's By Request Stock O' The Day. If you have a stock you're interested in, send an email to [email protected], naming the stock, and why you think Doc should look at it, in 25 words or less. 26 words, and you're disqualified! Those that look interesting, Doc will try to feature here within the next day or two. If you have suggestions about other features you'd like to see, send them along to [email protected]. Again, thanks for subscribing!
|
![[Most Recent XAU from www.kitco.com]](http://www.weblinks247.com/indexes/idx24_nasdaq_en_2.gif)
![[Most Recent XAU from www.kitco.com]](http://www.weblinks247.com/indexes/idx24_sp500_en_2.gif)
![[Most Recent Quotes from www.kitco.com]](http://kitconet.com/charts/metals/gold/t24_au_en_usoz_2.gif)

 Chart Powered by METASTOCK