|
10 Minute Bar Charts 4/23/02 Dow Jokes Inflatables
Archives 12/30/01, 1/1/02, 1/2/02, 1/3/02, 1/4/02, 1/7/02, 1/8/02, 1/09/02, 1/10/02, 1/11/02, 1/14/02, 1/15/02, 1/16/02, 1/17/02, 1/18/02, 1/22/02, 1/23/02, 1/24/02, 1/25/02, 1/28/02, 1/29/02, 1/30/02, 1/31/02, 2/1/02, 2/4/02, 2/5/02, 2/06/02, 2/7/02, 2/9/02, 2/11/02, 2/12/02, 2/13/02, 2/14/02, 2/16/02, 2/19/02, 2/20/02, 2/21/02, 2/23/02, 2/25/02, 2/26/02, 2/27/02, 2/28/02, 3/1/02, 3/04/02, 3/05/02, 3/06/02, 3/7/02, 3/10/02,3/11/02, 3/12/02, 3/13/02, 3/14/02, 3/15/02, 3/18/02, 3/19/02, 3/20/02, 3/21/02, 3/22/02, 3/25/02, 3/26/02, 3/28/02, 3/30/02 4/1/02, 4/2/02, 4/3/02, 4/4/02, 4/6/02, 4/8/02, 4/9/02, 4/10/02, 4/11/02, 4/13/02, 4/15/02, 4/16/02, 4/17/02, 4/18/02, 4/20/02, 4/22/02, 4/23/02
|
The Anals of Stock ProctologyPublished 5 times
per week by the American Academy of Stock Proctology and Bouncy Bouncy - Pre-Market Outlook (4/24/02) The one day cycle made a low yesterday in the last few minutes, and fucutures headed higher overnight. All of the 1 day and 8 day cycle downside cmaps were hit in the late selloff yesterday, and it doesn't take a genius to figure out that our fellow chartists like to buy double bottoms, which is where things stood coming into the bell. When AMZN's quarterly loss was not as bad as expected, that's all the excuse buyers needed. It's too early in the cycles for any upside projections based on the market averages. Suffice to say that Doc doesn't expect much. The fucutures rallied right after the bell and continued rising through the night. The 1 day cycle upside cmap on the SP's was 1108-1111. Cmap on the ND's was 1350 +/-, which is a gain of 16 from the 4 PM price and suggests a high of 1745-1750 on the Nas. However, right after the weak durable goods orders came out (no surprise to stoolies), the futures dipped, and the all sessions 1 day cycle ozzies turned down. At 9:05 AM futures started to weaken badly. The market averages may not be able to reach the futures cmaps, and yesterday's lows may be tested early. Looks like a lot of churning this morning. The time to look for one day cycle highs on the averages will be 10 AM and 11 AM. The open question is whether a swup will develop for a few days as a result of the 8 day cycle turning up, or will the down phase of the 13 day cycle sweep prices through the lows later today? Stay tuned for the mid-day update around 1 PM when there should be some clues. Methodology and Terms. AM Updates Below Sucktor Watch
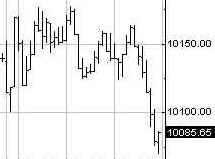
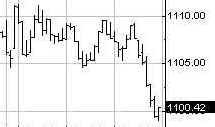
The Dow Inflatables deflated by 47 on Tuesday. The 13 day and 4-5 week cycle oscillators downticked, while the 10-13 week oscillator idles at a negative level. The 6-7 week cycle oscillator is poised to turn down after a 3 week long sideways up phase. The 10-13 week cycle centered moving average projection is now down to 9775-9925. The current consolidation pattern also measures a move to about 9800. The 10-13 week cycle low could occur at any time over the next 3 weeks. If the 4-5 and 6-7 week cycles turn down before that cycle turns up, the decline could easily exceed current projections. The Feed drained today, adding only a $1.5 billion overnight repo to only partially refund yesterday's $2.25 billion. So far this week the Feed has been slightly net negative, continuing the trend of stinginess from last week, and the last few months. This, of course, has a direct correlation to the market's behavior. The question is, what is the Fed up to? A policy of tightness at this point seems counter to their aim of getting the economy off the ground, (which we know is hopeless anyway) unless of course they really are worried about inflation. Or maybe they're just holding off, trying to sop up some of the gross excess that's already out there, perhaps in anticipation of the need for a truly gigantic feed to support the market when it finally collapses. So lets be aware, and wary of that possibility. Meanwhile the poodits blame everything they can think of for this crappy market, except the real causes. Not a single analcyst has talked about the Fed's apparent relative tightness or the declining money supply. Not a single analcyst has mentioned the contraction in the refi bulge. And on proctovision, you'll never hear anyone utter the words "bear market", for the obvious reason. It makes people turn off the TV. Portfolio Sphincters Index (SPX) and Sentiment The SPX lost 6.87. The 17 day rate of change, a proxy for the 6-7 week cycle, stalled after beginning to head weakly higher last week, and now has whipsawed back to a sell signal. This cycle has been heavily skewed to the downside, with only very short uplegs. This downleg could last 4 or 5 weeks, unless an upturn in the 10-13 week cycle intervenes. The 6-7 week cycle oscillator superimposed on the chart gave an early buy signal and continues to rise. Price is leading because of this skew to the downside. Assuming a sell signal does come in this indicator over the next few days, a late sell signal is extremely bearish. Obviously there would be a very different interpretation if the market were to rally hard off this double bottom. Without direct stimulus from the Feed, ain't gonna happen. Of course, Al can pump the gas whenever he wants. The short term linear regression channel continues to show a tightly defined downtrend. The 29 day rate of change, representing the 10-13 week cycle, is weakening again. If it breaks the double bottom look out below. Otherwise, she'll bounce again. The VIX closed at 22.13 , up from 21.72 Monday. Low option volatility continues. This has always been associated with important tops over the past four years. On the inverted scale chart, VIX has begun to drop below the top band, indicating that the big decline may finally be starting in earnest. One more down day will finally reverse the trend of decreasing volatility that began at last September's lows. As for where a real rally might launch, the last big short term rally came from the 27-28 area, and a big intermediate swing rally probably won't come until the index is well above 30. The blue channel lines are the extension of a linear regression channel from the February and May 2001 highs.
The cycle picture looks like it's getting in gear to the downside in the context of a top in the 5-6 month cycle. The market does not have the strength to go higher without help from the Fed. For the last couple days I've mentioned that from a cyclic standpoint there are two probable time periods for a big breakdown, now, or June. The short cycle oscillator has turned down hard, so the probabilities are increasing that it's now (and perhaps again in June. If the 5-6 month cycle oscillator also drops from here, this is The Big One.
Fibo support levels are 1100 and 1075-80.
The Cycle Conditions tables include cycle phase and a wild guess as to number of periods to the next turn, in days for the shortest cycles, weeks (W) or months (M) for the longer ones. This is a fluid exercise, in other words, the projections are likely to be wrong, but they force us to be vigilant for key turning points, and frequently work well enough to prevent costly misreadings. SPX Cycle Conditions as of 4/23/02
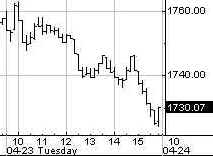
PTT - Periods Till Turn Nasgap Charts The Nas shed another 28. This is a classic picture of a trendline breakdown, return to the scene of the crime, and fall away. The index is back to the center of its downtrending cycle channels. Short cycle oscillators are heading down. The 6-7 week and 4-5 week cycles appear to be heading down. The 10-13 week cycle oscillator is still topping. The 5-6 month cycle is in a top that could break down at any time. It bears repeating that topping out at levels below neutral is usually a sign of impending disaster. However, one more bounce off the prior lows would be typical. The 8 and 13 day cycles are the big question at this moment. If the 13 rules here, we're likely to see 4-5 days of straight down action, as all cycles will be momentarily in gear to the downside. On the other hand, an 8 day cycle low could trigger short covering, and a temporary respite from the decline.
Fibo support levels are at 1745 (broken, now resistance) 1699, which is the old low, and 1660.
Nasdaq Cycle Conditions as of 4/23/02
PTT
- Periods Till Turn Sucktor Watch - Dirty Dirty SOX The 7 month
uptrend line was finally broken last night. It looks like the cycles may
get in gear to the downside for awhile. After a reaction to the trendline,
the next move should be to 500. Internut Index Long term stoolies know Doc is no newcomer to the I Hate Internet Stocks club. Here's what Doc said about AhOL on December 19, 2000. Wake up world. When are you going to realize that the web is a profitless medium, the model of perfect competition. Dr. Stool has said this before, he will say it again. Any pimple faced teenager with half a brain and a good idea can build an empire over night. Just what does AOL have that no one else does, the most irritating pop up ads? Poor Gerry Levin, Steve Case, the ultimate flim-flam man snookered him too. Does that guy remind anyone of Al Capone?
The market has, as always, caught up with Dr. Stool a year and a half later. (Being early was not good for Doc in 1999, as you can imagine.) Last night another of Doc's favorite whipping boys, AMZN, issued its quarterly loss report. Internut stocks, unlike some companies, do not have quarterly earnings reports. The loss was less than expected, and the stock rallied. The Internut Index is at a double bottom, so the news might be good for another of those Roman candle flameout rallies, but overall the chart still looks horrible. The September lows will be broken at some point in the not too distant future.
Stoolwethers- AMZN Looks like
Amazon has yet one more rally left. What an annoying stock. Let's see how
it does as it attempts to retest the highs. Stock O' The Day- LNOP Got a
request for this one from stoolie stalwart richmtn. Thanks rich! Wow,
helluva short squeeze! This is a small cap with 7.3 million shares of
which 40% are in insider hands. Float is 4.2 million shares and 15% of
that is in institutional hands. Real easy to play games with this one,
especially with average daily volume of only 85,000. Short interest is
just 65,000 shares, just 1.5% of float, but with this kind of small cap,
anything can happen. The last pop might be a blowoff, but it's too early
to know for sure, and Doc personally wouldn't short a stock in such a well
defined uptrend. It looks like it will head higher after this pullback. In
the future, Stock O' requests should stick to big cap stocks, where Doc's
powerful influence will not move the market as much as with a small cap!
If you have an idea for a Stock O', send it to [email protected]. Include some original reason for why you think the stock is deserving. Be clever! Anything longer than 25 words- automatic disqualification! And please, no penny stocks. Feel free to request follow-ups too. Uncle Buck's Illness
Was last week merely a near death experience? Can Uncle Buck sit up in bed
yet again? He's hooked up to life support here, but it doesn't look
good. If the intermediate cycle oscillator breaks down at this level,
it may be time to throw the dirt on the coffin. Golden Stool The Amex
Goldbugs Index remains in a cyclic correction while price inches higher. This is powerfully bullish. The consolidation is likely to
lead to an explosive upside breakout. It could come at any time
over the next month. Bonds
rallied and yields fell slightly. Investors still are uncertain as to whether
it will be inflation, deflation, or perfect harmony. Is the uptrend
broken, or not? Don't know yet. It's time for yields to turn up, but there
are no signals yet. See you in Intraday Stool. Dr. Stepan N. Stool Let me know what you think on the Stool Pigeons Wire. Welcome To New Subscribers Welcome, and thank you for subscribing to the Anals of Stock Proctology. You may note some subtle differences in style now that this is no longer a free service. The perspective is still bearish, but it will have a more balanced approach than my message board ravings. You won't see me screaming "BUY" about anything except perhaps gold, but you will see stronger indications of areas and times when I think it might be a good idea to avoid being short. And I promise that I will lose my temper from time to time to keep you entertained! There's also a new feature, Doc's By Request Stock O' The Day. If you have a stock you're interested in, send an email to [email protected], naming the stock, and why you think Doc should look at it, in 25 words or less. 26 words, and you're disqualified! Those that look interesting, Doc will try to feature here within the next day or two. If you have suggestions about other features you'd like to see, send them along to [email protected]. Again, thanks for subscribing!
Explanation of Intraday Commentary-Build charts at http://www.livecharts.com. For custom time bars insert a comma after symbol and number of minutes, e.g. compx,90. This will give you a bar chart of the Nas with 90 minutes per bar. The one day cycle is usually most clear with 8 minute bars and 26/18 stochastics. It varies from day to day. Sometimes 6 minutes works best. Experiment to find the best fit for your trading style, and the market's dominant frequency at the time. The goal here is primarily to monitor the condition of the 8 and 13 day cycles. I typically use 90 minute bars with 26/18 stochastics for the 13 day cycle proxy on the indices during regular trading hours. Other cycles use 26/18 stochastics with the following: 8 days- 60 minute bars On the 24 hour futures charts, use a time per bar approximately 3 to 4 times the above number of minutes, to represent the cycles listed above. ABBREVIATIONS: cma: centered moving average |
![[Most Recent XAU from www.kitco.com]](http://www.weblinks247.com/indexes/idx24_nasdaq_en_2.gif)
![[Most Recent XAU from www.kitco.com]](http://www.weblinks247.com/indexes/idx24_sp500_en_2.gif)
![[Most Recent Quotes from www.kitco.com]](http://kitconet.com/charts/metals/gold/t24_au_en_usoz_2.gif)
 Chart Powered by METASTOCK