|
|
The Anals of Stock ProctologyPublished 5 times
per week by the American Academy of Stock Proctology and Available by annual subscription for $1929. (Just kidding, details to follow.) Warning - If you are not an experienced, independent, investor/trader, capable of forming your own opinions, and making your own decisions, PLEASE LEAVE THIS WEBSITE NOW! Like all poodits, Dr. Stepan N. Stool, the stock proctologist, takes no responsibility for anything, especially if you happen to agree with him when he's wrong! Please See Disclaimer Welcome to the The Anals of Stock Proctology, the new scholarly journal of the American Academy of Stock Proctology, edited by the world famous founder of the study of Stock Proctology, Dr. Stepan N. Stool PHandD. The Anals replaces Capitalstool's nightly and weekend updates of the major stock indexes. Now you can get your nightly stock proctology report in one convenient, uncluttered page, right here. The Anals will be available for free, for the immediate future. Some time between now and March 15, however, all advertising and solicitation will be removed from the Anals, and access to the Anals will be restricted to subscribers. As a result of the clean format, the Anals will be readily printable for reading in locations more appropriate to such endeavors, such as, uh, the kitchen table. Yes. The remainder of the site, including The Stool Pigeons Wire, IntradayStool, Stoolhoo, and Stoolchat, will continue to be free. You will never have to pay for access to these pages. Previous contributors to Capitalstool will receive a free subscription period. Prior to going to a subscription format, the voluntary pay buttons will remain. So feel free to contribute now. Your contribution will result in a full credit toward your future subscription. Several of you have already contributed in excess of $500, and you will receive a free lifetime subscription. Contributors of written content or illustrations used on the Capitalstool front page will also receive free subscriptions. That includes all who achieve the level of Professor of Stock Proctology on the Stool Pigeons Wire. Initial subscription rates will be $19.29 for a 3 month trial and $74 per year thereafter, in honor of the great bear markets of the 20th century. As always I thank you for your support, and I look forward to many prosperous years working together with you. Dr. Stepan N. Stool February 19, 2002
Don't Rain On Their Parade (3/1/02) The Dow Inflatables blew through the top of the bulloney bullhorn. Is this the greatest blowoff in history, or yet another bubble that's gong to last awhile? The upside centered moving average projection for the 6-7 week cycle is at least 10,400, and may be as much as 10,800. The 10-13 week cycle projection is 10,600, so far. Momentum is strengthening. Hey, who are we to rain on a parade?
Wisdom of the Poodits In the ongoing exercise of reviewing daily poodit commentary in one big pile, where it belongs, here is today's poodit wisdom. Pay attention to the subtle difference between remarks coming from the buy side of the Street, and the sell side. [Dr. Stool's comments in brackets] Buy Side Poodits Portfolio Sphincters Jeffrey Kleintop, chief investment strategist at PNC Advisors, said economic recovery expectations at last won over accounting worries in dominating investor sentiment. [For now.] "Accounting fears are starting to subside. People were looking for a sign and they now may become believers," said John Waterman, managing director of investments at Rittenhouse Financial. "This could mark the start of a sustainable move higher. I think the earnings growth story for the tech sector is a 2003 one. It'll take more time because of the excesses." [Bulls are spiritualists. Bears are skeptics.] ``By the third quarter, earnings are going to be very good,'' said Marc Klee, who manages the $1 billion John Hancock Technology Fund. His top holding is Micron Technology Inc. [Enough said.] "Right now the general direction is up and that's because of the economy," said Michael Carty, principal at New Millennium Advisors. "But there is still a tremendous amount of skepticism about analysts' forecasts and the ability for corporations to repair profits that could challenge us next week." The game of follow-the-leader is being played backwards, Carty said. Economic reports tend to be lagging indicators and "the markets should be leading the economy." [No, the market is the economy. They move together.]``All the signs are pointing toward a recovery,'' said Bruce Bartlett, Oppenheimer Growth Fund. The rebound is ``going to be more moderate'' than people expect, said Bartlett. He wants to own companies that don't depend on an economic revival to increase sales and profits. [Cautious but not pessimistic.] ``People are saying, `If the economy's going to get better I want to be in {Dow} stocks,''' said Tony Maramarco, Babson Value Fund in Cambridge, Massachusetts. ``These companies are going to have earnings. Many technology companies aren't.'' [The Turdy Thirty.] Charlie Crane, Victory SBSF Capital Management - ``You want to have a cyclical flavor to your portfolio,'' Crane said the economy will probably grow 3 percent to 4 percent this year, outpacing the expectations of most investors. ``Cyclicality has been favored'' so far this year, he said. In addition, ``simplicity has been favored over complexity,'' he said. Sell Side Poodits Ego-nomists "We've seen a clear pickup in consumer spending and housing and now the manufacturing sector," Mickey Levy, chief economist at Bank of America. "I'd say with a couple more months, businesses will start to gain confidence." [Actually, housing activity is down. See below.] Strat-ego-ists ``Money continues to be deployed in the safety zone rather than in risky areas, so it remains a stock-picker's market,'' said Alan Ackerman, market strategist at Fahnestock & Co. in New York. ``I would look for a little up tilt in the market.'' [Safety zone? He means the Turdy Thirty.] "There are thousands of companies that are honestly run, but ... Enron has spilled over into other companies," Bernadette Murphy, market analyst at Kimelman & Baird. "I think Enron is unique, but the worry is still there." [Enron may be unique, but there's more dirty laundry out there.] Technical Analcysts - None today Traders - None today Analcysts - None today Others Research and Ratings Firms The current economic recovery was officially established by the
February ISM [reading on Friday]," commented John Lonski, chief
economist at Moody's Investors Service. "[While] first-quarter
operating profits should still drop year-to-year, the fact is that the far
majority of macroeconomic indicators suggest that a bottoming of the
corporate credit cycle is fast approaching," Lonski said. [He's
hallucinating.] Joe Liro, equity strategist at Stone & McCarthy Research Associates, said the market has discounted a turn. "Everyone realizes that we are in the early stages of an expansion[Except a handful of wild eyed skeptics like Doc.] Now that has to feed through to [companies'] bottom lines." [Gotta get past the debt service first.] First Call expects "meaningful downward revisions" for the first half of the year's results. "Although visibility on 2002 earnings is limited at this stage, we believe 2002 growth will likely be only in the single digits rather than the adjusted 14 percent [that] industry analysts expect." [First Call's record is good. Their statement implies the rally is not sustainable.] ``I expect the markets to labor higher, with emphasis on the traditional leaders coming out of recession: basic materials, industrials, transportation and retailers,'' said Paul Cherney, chief real-time market analyst at Standard & Poor's Marketscope in New York. ``You have to differentiate between the markets and the economy,'' Cherney said. ``It is evident the economy has turned, but the market is grappling with the psychological problem of ... the aggressive accounting by some tech companies.'' [Again, the markets and the economy are tracking on exactly the same paths. They are concurrent. Both are effects of the same cause, the credit bubble. Very few people get this.] Summary The overall tone is now cautiously bullish, and very bullish focused on the Dow. There are few outright bears, with the only cautionary note coming from First Call. The implication is that major commitments have been made to the Dow, that very little firepower remains on the sidelines, and that the rally will remain narrowly based, for whatever its duration. And while the rally may continue for a few days, the pace set by Friday's moonshot is not sustainable. The above quotes culled from Boomberg, SeeBS.Markethype, Rhoiders, and that outfit with half a dozen national media names whose stock is going down the drain. Just In Case We Really Are Dead The Bear is my shepherd; I shall not
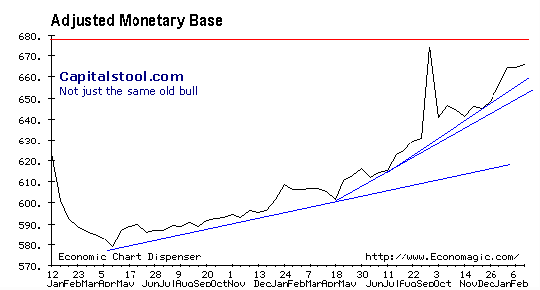
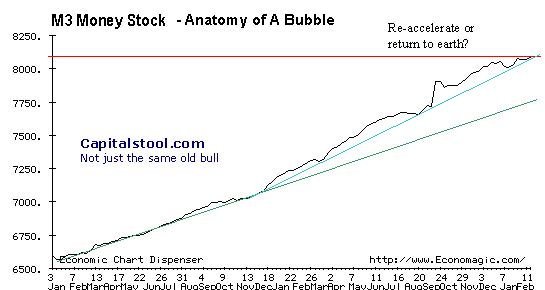
want. The Feed and The Market The FOMC under FBI* Director Al Greenspew, was tight last week, refraining from rolling nearly $5.9 billion in repurchase agreements and adding only $1.45 billion to government securities held outright, for a net drain of $4.5 billion through Wednesday, February 27. Thursday they came in with a $6 billion dollar 28 day repo and a $2.5 billion overnight repo, and Friday, they added %4 billion in over weekend repos. These numbers were not excessive, as an average of 5 to 5.5 billion dollars per day is necessary to maintain the status quo by rollover of the existing outstanding paper. *Financial Bubble Inc. Over the next 15 days the Fed will need to replace $28.5 billion in maturing securities and $27 billion in repos coming due. Let's say that's a total of about $26 billion per week over the next two weeks, plus some pocket change to maintain the targeted growth rate which appears to be about 1% per month in the monetary base. The Fed is actively promoting inflation in order to keep the credit bubble from imploding and destroying the world financial system. So far all this feeding probably has prevented one or more horrendous crashes in the market. The Fed has direct control over the Adjusted Monetary base. They are moving it up at a trend growth rate of about 12% annually. Policy has been aggressively inflationary since April of last year. That's when the real feeding began. The stock market has not responded all that well, but ther has been aggressive speculation in the housing market, a self feeding process between the GSE’s reflected in M3 and housing data. (See charts below)
Contrary to poopular opinion, the Fed has a lot less control over M1. The commercial banking system has to cooperate by lending on those reserves, and the markets have to cooperate by not imploding. As of the week ended February 18, the markets were weakening, and suddenly, M1 bulged. It’s not clear from where, but for now, the additional liquidity appears to have temporarily rescued the stock market from the edge of oblivion.
The question is with news of economic strengthening, how will the bond market respond to another burst of money growth. The answer may have been tipped on Friday when bond prices fell sharply and bond yields shot up. The boys in the bond pits just aren’t going to tolerate this aggressively inflationary policy by the Fed, and future unfettered credit creation by Fannie, Freddie, and the FHLBB. Is M-3 growth slowing, or getting ready to explode upward again. In order for the latter to occur, interest rates would need to drop further. That, boys and girls ain’t gonna happen, as any further easing would result in a selling panic in bonds that would make the 1987 crash look like a Sunday afternoon tea. (If you are not reading the Credit Bubble Bulletin, start!) Meanwhile the Mortgage Bankers Association, the chief shills for the mortgage and residential housing bubble, had this to say last week. (By the way if you think stock borkers are crooks, you ought to hang around these guys for awhile.)
The bottom line is that as interest rates stabilize mortgage activity is slowing. Without refinancing the bubble implodes. A couple more upticks in long term rates means that the refi door will slam shut, and the bubble will implode.
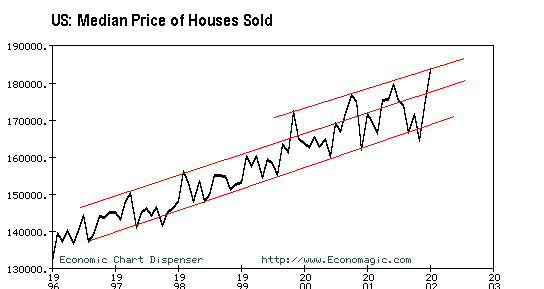
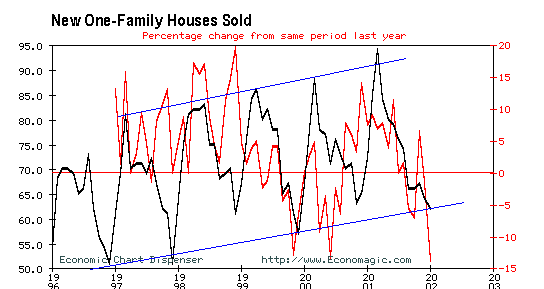
But back in January (latest data), some pretty astounding things were happening in the housing market.
Check out the blowoff in the average house price, which is skewed by high end housing values.
But while prices were exploding, look what was happening to volume. Volume dropped 15% from the same period last year. The data from February are going to be real interesting.
Finally we’ll leave you with this from the ECRI. Strong growth in the Leading Indicators tracked gains in the stock market. When the market pulled back so did the LI. The question now is, has the economy stalled, or is the market going to tell us something more this week.
|
|||||||||||||||||||||||||||||||||||
|
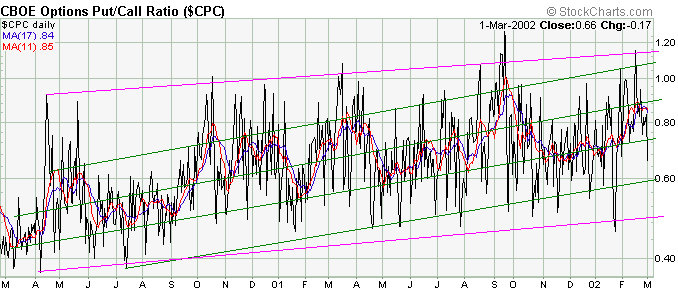
Getting Sentimental The 11 day put call ratio only reached the center of the linear regression projection. This is one of those horrendous situations which can be interpreted in two ways, with opposing implications. Either these levels are high enough to signal only a short term rally, or the long term trend in this indicator is beginning to shift back toward greater optimism, which would indeed indicate a new bull market. This is inconclusive. No help at all. It illustrates the problem with reliance on sentiment. Sentiment follows the trend. It tells us nothing we don't already know from analyzing price indicators.
This kind of inconclusive data tells us that the market trend is inconclusive, and that the slot rattling is not finished. Slot rattling is the rapid fire racing of price from one extreme of a trading range to the other because longer term bids and offers have been cleaned out in the middle of the range. In other words, the market is "thin." One or two more days of higher prices which were able to stick at those levels would be necessary to confirm a more improtant reversal.
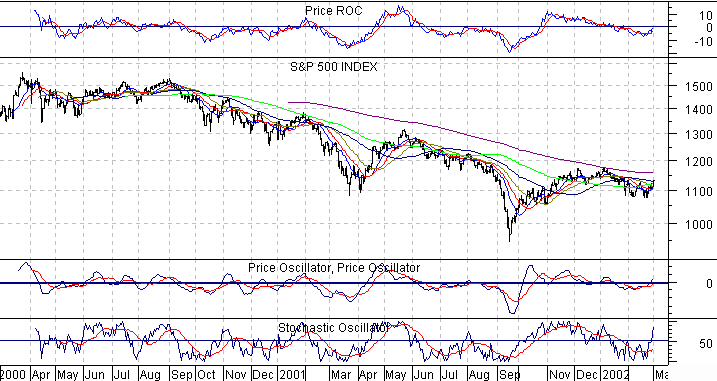
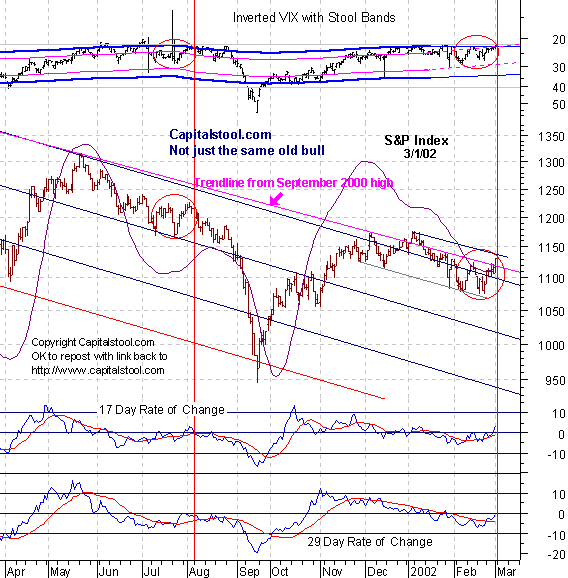
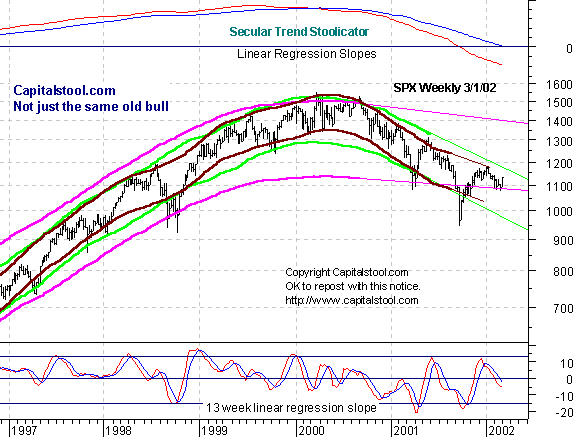
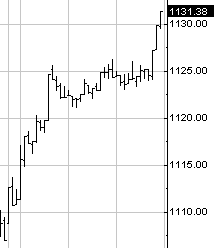
SPX Charts The VIX, a sentiment indicator based on options volatility, closed at 22.13. Complacency reigns, as traders feel good about future prospects. Momentum is starting to turn positive. If the gains can be held on Monday, things could get a lot worse for bears in the weeks ahead. The operative word is "if." At this point it looks as though the mania has reignited. But the picture still looks remarkably like last summer. No two periods are exactly alike, but from a cyclic perspective the market looks like it looked then, with sentiment and momentum at virtually identical levels. Unless prices break decisively above 1145, THE BEAR CASE ISN'T DEAD yet. Another day like Friday, and it is, at least for now.
1145 is the last line of defense. I would not want to see that broken for more than a day or two, or move more than 15 points above the line.
When you look at the weekly chart, this doesn't look all that significant. If you're a day trader or short swing trader, it was a killer.
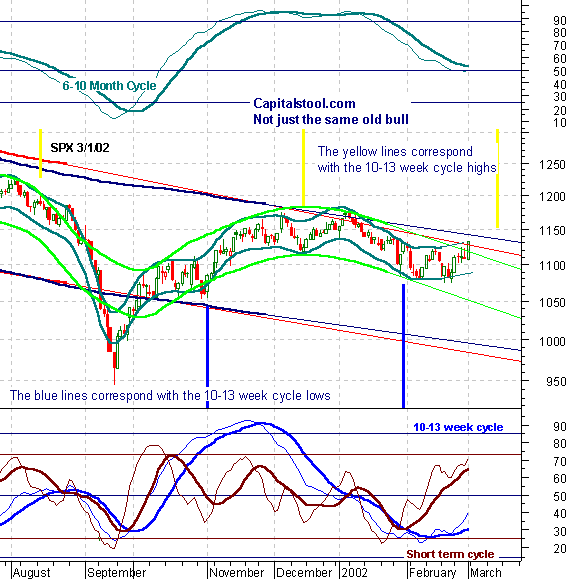
The ascending 10-13 week cycle has reached the moment of truth as it has blown through the descending upper wave band projection of the 6-10 month wave. It will either break through that band, or it will begin to break down. Friday might have signaled a trend change, or it might not have. IT was one of those days where it would have been better to shoot first and ask questions later. If it was a trend change, there's going to be a helluva lot more pain for bears. Time counts for the shortest cycles have reached ground zero. The market either turns down Monday or Tuesday, or the slopes of these large channels begin to be altered significantly. At this point, the 6 month cycle oscillator still has not confirmed the upturn, and wave edge breaks are just as likely to mark the end of the move, as to signal a reversal. If you look at the 6-7 week cycle in teal, the timing looks more like a top. So I'm not ready to abandon the bearish view.
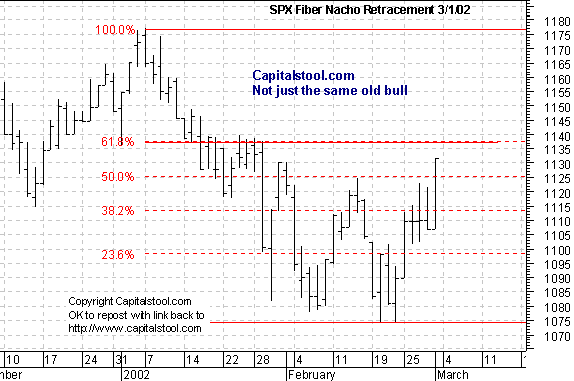
The next fiber nacho regurgitation level is at 1137.
The Cycle Conditions tables include cycle phase and a wild guess as to number of periods to the next turn, in days for the shortest cycles, weeks (W) or months (M) for the longer ones. This is a fluid exercise, in other words, the projections are likely to be wrong, but they force us to be vigilant for key turning points, and frequently work well enough to prevent costly misreadings of the market. SPX Cycle Conditions as of 3/1/02
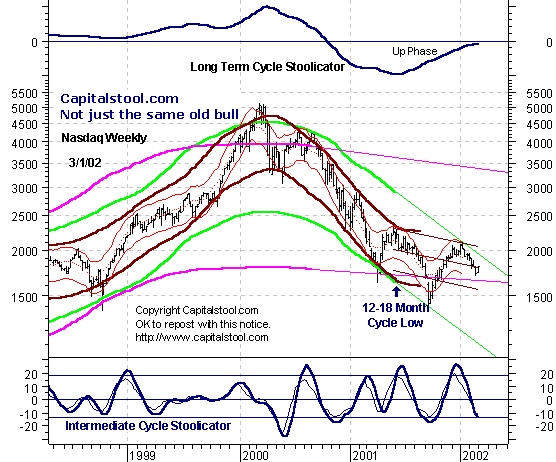
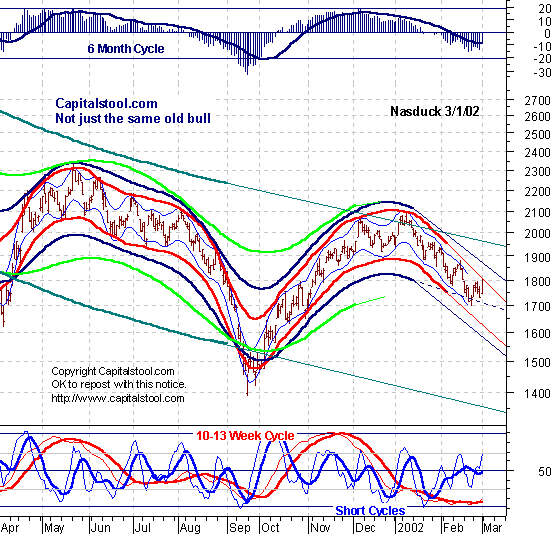
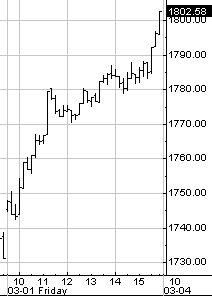
PTT - Periods Till Turn Nasdaq Charts This is an crucial time frame on the weekly chart. The intermediate cycle indicator is near a low. An upturn at this point, with the 12-18 month cycle still in a nearly flat trend could lead to a very sharp rally. If the long term indicator climbs above the zero line, it's bad news for bears, very bad news indeed.
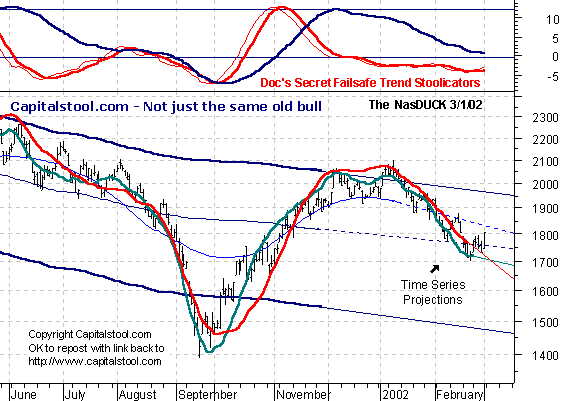
The evidence of a turn is unconvincing at this point. That doesn't mean it won't be on Monday or Tuesday. I'll have to wait and see. The shorter cycles have been in up phases for the last several weeks, although you wouldn't be able to tell that without extremely sensitive filters. And the longer cycle indicators still haven't come off the floor enough to signal a turn. Others may be willing to say go here. I'm not. I will admit that it's possible that the Nas is coming off a new 10-13 week cycle low, and that I had the counts wrong. If that is the case there's tremendous intermediate upside risk here. Short term upside centered moving average projections are now 1825-40. Whether that's a final blow off, or simply a resting place to higher highs isn't clear.
The stark similarities between this cycle and the last intermediate wave are uncanny, except for one thing. The market is weaker now. Even with time series analysis, it just isn't clear that this upturn is significant.
Nasdaq Cycle Conditions as of 3/1/02
PTT
- Periods Till Turn Golden Stool Here's something you can feel good about for now, the weekly chart of the gold stock index.
Long Bong Hit It's too early to tell whether this upturn in bond yields is just a short term cycle, or something more important. Watch the 5.05-5.10 area. If it can get through there then the intermediate leg is here, and it will get to 5.50, fast.
Here's what I said Thursday night about MyBM.
Looks like I was right about everything except the most important thing. I guessed wrong about getting off it's ass. now it will be interesting to see what will happen when it gets up into the 109 area. There are a lot of bullish signs in this chart. If the rally can be sustained and then hold in the 109 area, the implications for the bear case would be extremely bad.
The Stock Proctologist's Bottom Line Dr. Stool remains a skeptic and a hard core bear. Sure the upturns are there on the charts, butt so far there simply is not enough evidence that this rally isn't just another, bigger, better fakeout. Sustained strength on Monday and Tuesday, would change that, but for now, that's the way it is. Finally, Dr. Stool has learned from long experience that, when plagued with uncertainty, stepping aside is an honorable and wise thing to do. So what if the market turns tomorrow! There's always another streetcar (ok bus). If the bus starts going the wrong way, get off, walk to the next stop, and then catch another one. And don't take a bus going the other way unless you are absolutely sure it's going to get there. Preserve your capital, and live to fight another day! See you in Intraday Stool. Let us know what you think on the Stool Pigeons Wire. Archive |


![[Most Recent XAU from www.kitco.com]](http://www.weblinks247.com/indexes/idx24_nasdaq_en_2.gif)
![[Most Recent XAU from www.kitco.com]](http://www.weblinks247.com/indexes/idx24_sp500_en_2.gif)
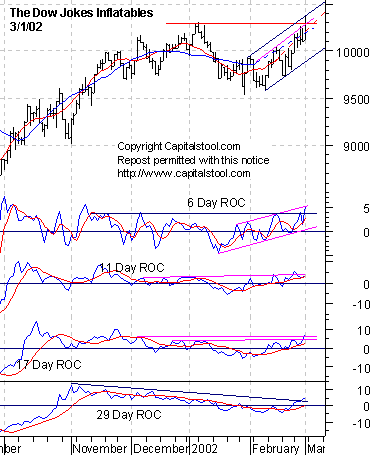
 Chart Powered by METASTOCK (Sorry about the bull.)