|
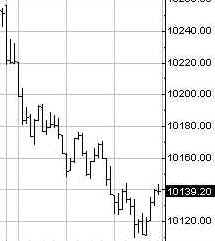
10 Minute Bar Charts 4/22/02 Dow Jokes Inflatables
Archives 12/30/01, 1/1/02, 1/2/02, 1/3/02, 1/4/02, 1/7/02, 1/8/02, 1/09/02, 1/10/02, 1/11/02, 1/14/02, 1/15/02, 1/16/02, 1/17/02, 1/18/02, 1/22/02, 1/23/02, 1/24/02, 1/25/02, 1/28/02, 1/29/02, 1/30/02, 1/31/02, 2/1/02, 2/4/02, 2/5/02, 2/06/02, 2/7/02, 2/9/02, 2/11/02, 2/12/02, 2/13/02, 2/14/02, 2/16/02, 2/19/02, 2/20/02, 2/21/02, 2/23/02, 2/25/02, 2/26/02, 2/27/02, 2/28/02, 3/1/02, 3/04/02, 3/05/02, 3/06/02, 3/7/02, 3/10/02,3/11/02, 3/12/02, 3/13/02, 3/14/02, 3/15/02, 3/18/02, 3/19/02, 3/20/02, 3/21/02, 3/22/02, 3/25/02, 3/26/02, 3/28/02, 3/30/02 4/1/02, 4/2/02, 4/3/02, 4/4/02, 4/6/02, 4/8/02, 4/9/02, 4/10/02, 4/11/02, 4/13/02, 4/15/02, 4/16/02, 4/17/02, 4/18/02, 4/20/02, 4/22/02
|
The Anals of Stock ProctologyPublished 5 times
per week by the American Academy of Stock Proctology and AM Updates Below Uncle
Buck Morning Sickness - Pre-Opening Prognosis (4/23/02) The expected 5 hour low at 3 PM yesterday came on schedule, and the market was in an up phase at the close, but fucutures have weakened in the last two hours, clouding the picture. As of the close the Nas had an upside cmap on the 5 hr cycle of only 1758-60, but 3 day cmap to the downside of 1730. The upside 5 hr cmap on the SPX was 1108, while the downside 3 day cycle cmap was 1098. The 3 day cycle projected lows are due today. The 8 day low is due today on the Nas and over the next two days on the SPX. 8 day cycle cmaps are uncertain for the Nas and 1100 for the SPX. Cmaps on the current 1 day cycle on the futures are 1104.50 on the Sp's and 1343 on the Nas 100, a double bottom. That corresponds with a low of 1745-50 on the Nas. Overall the downside looks limited here, as an 8 day cycle low is imminent. The intraday timing is very murky, but a 5 hr low at around 1 PM is my best guess for the 8 day cycle low as well. After that, a swup, of course. Terms and Methodology
The Dow Inflatables deflated by 120, falling squarely back to the linear regression dating from the March 18 high. (not shown) Last week's one day wonder rally seems like a distant dream now. The cycle oscillators are giving mixed indications, with the shorter ones looking ready to turn down and the 10-13 week cycle looking potentially like it wants to turn up. Flat however, is not up. Two possible centered moving average projections result in a cmap range of 9875 to 10,035. That, as always, will adjust day to day until a trend change is clearly signaled. The Feed was quiet today, adding just a 2.25 billion overnight repo, which was a net drain of $750 million, since Friday's weekend repo was $3.0 billion. They made up for that with a $703 million coupon pass. Just another day in the Fed's starvation diet for the markets. The market cannot survive without aggressive Feeding and right now, it ain't gittn' none! So this could be The Big One. Shorter cycles are getting in gear to the downside as the major averages approach key support. This issue now from a technical perspective is whether that support holds for one more bounce or not. Sentiment remains extraordinarily complacent and Wall Street analcysts and poodits continue to talk about the problems of "this bull market." Once the support breaks, one can only wonder what the poodits will have to say about "this bull market.". Portfolio Sphincters Index (SPX) and Sentiment The SPX was virtually unchanged Friday. The 17 day rate of change, a proxy for the 6-7 week cycle, stalled after beginning to head weakly higher earlier in the week. The 6-7 week cycle oscillator superimposed on the chart gave an early buy signal and continues to rise. Now we need to watch for an early downturn in the indicator. The short term linear regression channel still suggests a tightly defined downtrend. The 29 day rate of change, representing the 10-13 week cycle, is turning down again, from negative levels. The VIX closed at 21.72, up from 20.3 Friday. Low option volatility continues. This has always been associated with important tops over the past four years. On the inverted scale chart, VIX has begun to drop below the top band, indicating that the big decline may finally be starting in earnest. The last big short term rally came from the 27-28 area. At this rate it will take weeks to get there, and a big intermediate swing rally probably won't come until the index is well above 30. The blue channel lines are the extension of a linear regression channel from the February and May 2001 highs.
The cycle picture appears to be getting in gear to the downside at least insofar as the 10-13 week and shorter cycles are concerned. This is in the context of a top in the 5-6 month cycle. The market does not have the strength to go higher, and the fact that it's unable to move strongly off key support suggests that a breakdown is out there. From a cyclic standpoint there are two probable time periods, now, or June. The short cycle oscillator has turned down from the sell zone, so maybe it's now. If the 5-6 month cycle oscillator also turns down, this is The Big One.
Fibo support levels are 1100 and 1075-80.
The Cycle Conditions tables include cycle phase and a wild guess as to number of periods to the next turn, in days for the shortest cycles, weeks (W) or months (M) for the longer ones. This is a fluid exercise, in other words, the projections are likely to be wrong, but they force us to be vigilant for key turning points, and frequently work well enough to prevent costly misreadings. SPX Cycle Conditions as of 4/22/02
PTT - Periods Till Turn Nasgap Charts In dropping 38, the Nas fell back to the center of its downtrending cycle channels. Short cycle oscillators turned down. The 6-7 week and 4-5 week cycles appear to be topping out. Whether there's more backing and filling to complete the top, or it's straight down from here, we should know pretty quickly. The 10-13 week cycle oscillator is still topping. The short cycle oscillator has turned down from a top zone, with the index falling back from the top of a descending 5-6 month cycle wave band. The 5-6 month cycle is in a top that could break down at any time. It bears repeating that topping out at levels below neutral is usually a sign of impending disaster.
On the way down, fibo support levels are at 1745, 1699, the old low, and 1660.
Nasdaq Cycle Conditions as of 4/22/02
PTT
- Periods Till Turn Sucktor Watch - Dirty Dirty SOX Book to bill was at 1.04, the first positive reading since what, 1946? Anyway, the chart still shows lots of cycle conflict, suggesting more churning along this key uptrend line prior to an ultimate breakdown. Until the balance of the cycles get in gear, one way or the other, don't expect any follow through. This group continues to be supported by astronomical short interest.
Wally World
had another bad day yesterday. A rather ugly looking hunchback formation
has fallen down. Long term trend support is around 56, where a short cycle
low should begin to form. A stoolie whose name I don't have because of an equipment crash, sent in a request for MBNA Financial (symbol KRB), which unlike some of the bubble credit card stocks like, ahem, COF COF, (excuse me, had a little tickle in the throat there) hasn't bubbled. Probably because the funny mentals aren't bad enough. Seems the worse they are, the higher the stock shoots, because of too many shorts. But insiders have been selling mountains of this one, so maybe something's up. The uptrend certainly looks vulnerable, but a bounce from the 36-37 area may precede a breakdown.
I still have a few Stock'O's in the queue, but if you have an idea for one, send it to [email protected]. Include some original reason for why you think the stock is deserving. Be clever! Anything longer than 25 words- automatic disqualification! And please, no penny stocks. Golden Stool The Amex
Goldbugs Index remains in a cyclic correction while price remains at high
levels. This is powerfully bullish. The consolidation is likely to
lead to an explosive upside breakout. It could come literally at any time
over the next month. Bonds
rallied and yields fell Monday. This is a critical phase for indicating
whether the yield uptrend is still alive, or whether a flight to quality,
possibly signaling a deflationary debt collapse, is under way. Uncle Buck's Illness
Was last week merely a near death experience? Can Uncle Buck sit up in bed
yet again. He's hooked up to life support here, but it doesn't look
good. See you in Intraday Stool. Dr. Stepan N. Stool Let me know what you think on the Stool Pigeons Wire. Welcome To New Subscribers Welcome, and thank you for subscribing to the Anals of Stock Proctology. You may note some subtle differences in style now that this is no longer a free service. The perspective is still bearish, but it will have a more balanced approach than my message board ravings. You won't see me screaming "BUY" about anything except perhaps gold, but you will see stronger indications of areas and times when I think it might be a good idea to avoid being short. And I promise that I will lose my temper from time to time to keep you entertained! There's also a new feature, Doc's By Request Stock O' The Day. If you have a stock you're interested in, send an email to [email protected], naming the stock, and why you think Doc should look at it, in 25 words or less. 26 words, and you're disqualified! Those that look interesting, Doc will try to feature here within the next day or two. If you have suggestions about other features you'd like to see, send them along to [email protected]. Again, thanks for subscribing!
Explanation of Intraday Commentary-Build charts at http://www.livecharts.com. For custom time bars insert a comma after symbol and number of minutes, e.g. compx,90. This will give you a bar chart of the Nas with 90 minutes per bar. The one day cycle is usually most clear with 8 minute bars and 26/18 stochastics. It varies from day to day. Sometimes 6 minutes works best. Experiment to find the best fit for your trading style, and the market's dominant frequency at the time. The goal here is primarily to monitor the condition of the 8 and 13 day cycles. I typically use 90 minute bars with 26/18 stochastics for the 13 day cycle proxy on the indices during regular trading hours. Other cycles use 26/18 stochastics with the following: 8 days- 60 minute bars On the 24 hour futures charts, use a time per bar approximately 3 to 4 times the above number of minutes, to represent the cycles listed above. ABBREVIATIONS: cma: centered moving average |

![[Most Recent XAU from www.kitco.com]](http://www.weblinks247.com/indexes/idx24_nasdaq_en_2.gif)
![[Most Recent XAU from www.kitco.com]](http://www.weblinks247.com/indexes/idx24_sp500_en_2.gif)
![[Most Recent Quotes from www.kitco.com]](http://kitconet.com/charts/metals/gold/t24_au_en_usoz_2.gif)
 Chart Powered by METASTOCK