|
|
The Anals of Stock ProctologyPublished 5 times
per week by the American Academy of Stock Proctology and Available by annual subscription for $1929. (Just kidding, details to follow.) Welcome to the The Anals of Stock Proctology, the new scholarly journal of the American Academy of Stock Proctology, edited by the world famous founder of the study of Stock Proctology, Dr. Stepan N. Stool PHandD. The Anals replaces Capitalstool's nightly and weekend updates of the major stock indexes. Now you can get your nightly stock proctology report in one convenient, uncluttered page, right here. The Anals will be available for free, for the immediate future. On or before April 1, however, all advertising and solicitation will be removed from the Anals, and access to the Anals will be restricted to subscribers. As a result of the clean format, the Anals will be readily printable for reading in locations more appropriate to such endeavors, such as, uh, the kitchen table. Yes. The remainder of the site, including The Stool Pigeons Wire, IntradayStool, Stoolhoo, and Stoolchat, will continue to be free. Previous contributors to Capitalstool will receive a free subscription period. Prior to going to a subscription format, the voluntary pay buttons will remain. So feel free to contribute now. Your contribution will result in a full credit toward your future subscription. Several of you have already contributed in excess of $500, and you will receive a free lifetime subscription. Contributors of written content or illustrations used on the Capitalstool front page will also receive free subscriptions. Initial subscription rates will be $19.29 for a 3 month trial and $74 per year thereafter, in honor of the great bear markets of the 20th century. As always, I thank you for your support, and I look forward to many prosperous years working together with you. Dr. Stepan N. Stool February 19, 2002 The Anals will be accessible by subscription only beginning April 1. The subscription form will be posted a few days earlier, but there is no mechanism for pro rating if you subscribe early. To receive the full term, do not subscribe until April 1. When you subscribe through Paypal, you will immediately receive a user name and password which will allow you to access this page. If you have previously sent a donation through Paypal, and you would like a complimentary subscription equivalent to the amount of your contribution, send an email to [email protected]. Include your name, your email address, and if possible the date of your contribution(s) through Paypal. Upon confirming your information, I will send you a user name and password. Allow 1 week for processing. By requesting and accepting a complimentary subscription, you are agreeing that you have read and agreed to the Terms and Conditions, which basically says that you can't sue Dr. Stool, or Capitalstool.com, or its owner, no matter what! (If you emailed me this week, Thank you! I will send your user name and password this weekend. Restricted access begins April 1.) Finally, for you luddites who refuse to use on-line payment, you can subscribe by mail. The annual subscription rate for payment by check is $99.00. Print the subscription form at the bottom of the Terms and Conditions and mail it in to the address on the form, with your check, of course. I will email you a user name and password. Allow 2 weeks for processing for payments by mail. Thank you for your support! Doc
Is the rally over? The early signs are there, but a day like Thursday, where the market barely budges doesn't tell us much. If Doc is right that the rally was an anomaly, a short covering blowoff at the top of a one year cycle up phase, then it is likely that short and intermediate momentum and cycle indicators will trail price at the turn. But it is also true that if the signals are late, the downside move should be lengthy and deep. Late sell signals tend to mean that bigger waves are heading down. As intermediate waves get back in synch with the long term down trend, stock prices can decline for weeks on end with little respite. And that thousand point down day may yet be lurking. Given the exhaustion of demand that probably resulted from last weeks buying orgy, that's exactly what Dr. Stool expects. Lest anyone doubt, Doc still believes that stock price performance is likely to be negative both in real terms and nominal terms for years to come. An article he wrote a year ago comes to mind as still being relevant. The only period that comes close to being like this one, is the period from 1968 to 1973, only this is worse. Then it was the Nifty Fifty plus tech, now it's the Turdy Thirty plus tech. The preceding bubble was worse this time, and the credit bubble has been allowed to persist and grow, and has even been promoted, by the Fed. The adjustment from this bubble will be measured in decades, unless the Fed steps aside and allows the collapse to occur all at once. We all know they will persist in doing the opposite. They will try to manage the problem of too much credit by constantly attempting to make more available at the first sign of systemic stress, and we will have years of these vicious rallies in a deadened financial and economic environment. Look no further than Japan over the last dozen years for the road map. That's where we are headed. The FEED added some reserves Thursday, but overall this week, they actually shrank their holdings of government securities and repurchase agreements! The overall reduction was $3.9 billion. Let me repeat this. The Feed is no longer supporting the stock market, and they are actually already in tightening mode. We've seen the interest rates on 13 week bills creep up 25 basis points in the last month. There's no doubt that the Fed is no longer easy. They know they have a monster on their hands, and they want to try and deflate it a little at a time. So now they are going to tighten a little because the bond market is telling them they'd better, or it's going into freefall. The 10 year treasury yield shot up to 5.40, a new high for this move, and it shows no sign of stopping anytime soon. Doc believes that the economy has been held aloft by the mortgage refi bubble that has been "Fed" by abnormally low interest rates, and the infinite credit creation capacity of Fannie Mae and Freddie Mac. That bubble machine just ran out of liquid soap. As the number of mortgage apps starts to drop like a stone, the Fed is going to have difficulty keeping the money supply, the stock market, and the economy, from imploding, as long term bond yields continue to rise. The performance of the ever ballooning M3 will be critical over the next couple of months. Watch it begin to contract. So what is their alternative. Can they raise short term rates to ease the fears of the bond market. Think about the message that would send. A fragile economy on the hairlip of a phony recover, and the Fed has to RAISE rates? I don' think so. This has the makings of a Catch 22, with no way out. Then there's the issue of these stupid valuation models the portfolio sphincters use, that are based on the thesis that you can discount predicted future earnings of a company at the yield on a freaking risk free5 year Treasury Bond. How stupid is that? It's based on 3 assumptions that are completely idiotic, totally ridiculous. First is the idea that a stock's earnings yield should be discounted at the risk free rate of return. That is so obviously insane, one can only conclude that these people were recently released mental patients. Then there's the notion that you can forecast earnings five years into the future. Excuse me, but ho, ho, ho! Finally, there's the belief that somehow, current levels of intermediate and long term interest rates, i.e. the discount rate applied to these phony income projections, are somehow normal. Nothing could be further from the truth. 5% is not normal. It is an historic extreme, the result of a bubble, just like the stock market bubble. Normal is 7% or 7.5%, not 5%, and we will get back to normal and then some. What will these discounting models look like then? Please, somebody, I need a drink.
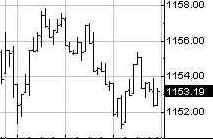
SPX Charts The VIX, a sentiment indicator based on options volatility, closed at 22.02, up from 21.97, still a low number indicating high complacency, but starting to track upwards, a sign that the market is starting to crack. Doc does not give much weight to sentiment indicators for timing purposes because it's impossible to know what is extreme, and how long the "extreme" will last. We can only know when they are, after they have turned. The majority is always eventually wrong, but just when will "eventually" rear its ugly head? However, the movement of sentiment away from an extreme usually accompanies a trend shift, so in that sense it is useful as a confirming indication. Price, and price based indicators are always the final arbiter, and they are beginning to "wheeze." We are looking at major negative divergences, so that if this thing turns before the divergences are resolved, these rallies have been nothing more than major distribution. The resistance at 1180 is beginning to look more and more formidable, and when the 17 and 28 day rate of change oscillators turn down, a reversal will be confirmed. That may come tomorrow or the next day. There's a growing likelihood that these sell signals will be late, because the top is probably already behind us. |
|||||||||||||||||||||||||||||||||||
|
Intermediate cycle indicators are still headed up, but short term cycles have topped out. A symmetrical parabolic cannot be ruled out, with the decline as violent as the advance, or even more so. The nature of a flat 1 year cycle up phase is becoming increasingly apparent on the chart. It has been in an up phase since the September 2001 lows, and is now making a second top. It's a mature cycle, and the recent rally definitely is smelling more like a blowoff top than a major bear market bottom. It looks like resistance held at 1170-80, and potential demand has already been absorbed in the buying panic. If the 6 month cycle oscillator is already starting to roll over, as it appears, this is a massive negative divergence that will lead to a huge price decline lasting months- the third leg of the bear market..
The Cycle Conditions tables include cycle phase and a wild guess as to number of periods to the next turn, in days for the shortest cycles, weeks (W) or months (M) for the longer ones. This is a fluid exercise, in other words, the projections are likely to be wrong, but they force us to be vigilant for key turning points, and frequently work well enough to prevent costly misreadings of the market. SPX Cycle Conditions as of 3/14/02
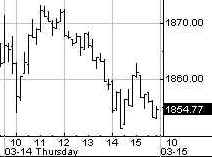
PTT - Periods Till Turn Nasgap Charts The six month cycle oscillator turned up in the Nas as well, but look how weak it is! And it remains in negative territory. This indicates an extremely weak up phase, and it could be a precursor to the complete collapse of the Nasgap. Short term cycles are topping out, and centered moving average projections around 1950-75 have been met. The rally could be reversed in its entirety relatively quickly. Preliminary downside centered moving average projections suggest that it will.
There's fiber nachos at 1850 and 1820. Downside short term centered moving average projections suggest that 1850 is as good as history, and that 1820 won't last long either.
Nasdaq Cycle Conditions as of 3/14/02
PTT
- Periods Till Turn Bork Attack! As we all know, the act of borking is what happens when a borkerage firm, analcyst, shill pumps a stock after the borkerage's trading arm has accumulated a ton of it, either by design, or by accident. Invariably, the borking itself causes the stock to top out, because everybody who had even the slightest inkling to buy the stock, panics, and they all jump in all at once. Goodbye, pent up demand, if there even was any. The result is always the same. You get screwed, or borked, because the guy managing your retirement finds is either too stupid to know better, or he does and doesn't give a crap, because, after all, it ain't his money! Doc will check back on these borkings every so often to illustrate the aftermath. Remember, ladies and gentlemen, stock borking is what borkers do. It's their business. Accumulate inventory, mark it up and move it out, just like any other retailer or wholesaler. They make money the old fashioned way, advertising, PR, and salesmanship! Which brings up a thought, perhaps the greatest borking of all time was when the NYSE's third largest specialist firm, Meehan, managed to bork itself to the dumbasses at FleetBoston at the top of the bull market! The deal was negotiated in late 1999 early 2000, and closed in July 2000. Now that was a borking for the ages! No Bork Report tonight. This feature will resume next week. Golden Stool The gold stocks remain in a short cycle down phase as they approach an intermediate cycle low in the next week or so. Notice how the 6-7 and 10-13 week oscillators are correcting without much downside movement in this down phase. That is very bullish for the longer term, although there might still be a short term spike down into the high 70's.
The opportunity cost of capital, i.e. the rate portfolio sphincters use to capitalize their imaginary stock earnings, is rising. The 6-7 and 10-13 week cycles in bond yields are heading up. The 6 month cycle is turning up. Expect to see the 10 year Treasury yield rocketing toward 5.75%. That will make stocks even more insanely overvalued.
Goodbye Buck. I f 116.50 doesn't hold, you are looking at a debacle in the making. Somebody very big is liquidating dollar denominated assets. Talk about the Dollar on the Stool Pigeons Wire.
See you in Intraday Stool. Let us know what you think on the Stool Pigeons Wire. Archive |
![[Most Recent XAU from www.kitco.com]](http://www.weblinks247.com/indexes/idx24_nasdaq_en_2.gif)
![[Most Recent XAU from www.kitco.com]](http://www.weblinks247.com/indexes/idx24_sp500_en_2.gif)
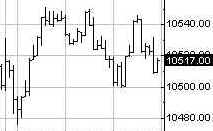
 The Dow continued to hover at its 6-7 week cycle centered moving average
projection. The shortest cycle oscillators are rolling over, but the all
important 17 day rate of change representing the 6-7 week cycle, and the
28 day R.O.C representing the 10-13 week cycle, have yet to confirm
a turn. The next down day should do it. Maybe the Andersen indictment will
give it a little push. It will at least be interesting to see how traders
react.
The Dow continued to hover at its 6-7 week cycle centered moving average
projection. The shortest cycle oscillators are rolling over, but the all
important 17 day rate of change representing the 6-7 week cycle, and the
28 day R.O.C representing the 10-13 week cycle, have yet to confirm
a turn. The next down day should do it. Maybe the Andersen indictment will
give it a little push. It will at least be interesting to see how traders
react. 
 Chart Powered by METASTOCK