|
10 Minute Bar Charts 4/9/02 Dow Jokes Inflatables
Archives 12/30/01, 1/1/02, 1/2/02, 1/3/02, 1/4/02, 1/7/02, 1/8/02, 1/09/02, 1/10/02, 1/11/02, 1/14/02, 1/15/02, 1/16/02, 1/17/02, 1/18/02, 1/22/02, 1/23/02, 1/24/02, 1/25/02, 1/28/02, 1/29/02, 1/30/02, 1/31/02, 2/1/02, 2/4/02, 2/5/02, 2/06/02, 2/7/02, 2/9/02, 2/11/02, 2/12/02, 2/13/02, 2/14/02, 2/16/02, 2/19/02, 2/20/02, 2/21/02, 2/23/02, 2/25/02, 2/26/02, 2/27/02, 2/28/02, 3/1/02, 3/04/02, 3/05/02, 3/06/02, 3/7/02, 3/10/02,3/11/02, 3/12/02, 3/13/02, 3/14/02, 3/15/02, 3/18/02, 3/19/02, 3/20/02, 3/21/02, 3/22/02, 3/25/02, 3/26/02, 3/28/02, 3/30/02 4/1/02, 4/2/02, 4/3/02, 4/4/02, 4/6/02, 4/8/02, 4/9/02
|
The Anals of Stock ProctologyPublished 5 times
per week by the American Academy of Stock Proctology and Just when things look like they are about to fall apart, the market confounds again. Rather than break down through the 6 month trendline on the SPX and Nas, the invisible hand of the Big Buyer in the Sky stepped in, caused a double bottom on the Nas chart, and buyers piled on in the afternoon. We saw no evidence that this was Feed driven, as there were no repos and only a small TIPS pass. Yet this was a big money Dow rally, so there was big money sponsorship. Whether that's sustainable is an open question. Doc has felt all along that without assistance from a flatulent Feed blowing gas into the credit bubble, that rallies could not be sustained. Time and again that's been proven right over the last three months since the Fed pulled in its horns and stopped playing stockholder of last resort. So we'll see if it's still true. The Mortgage Bonkers reported some interesting data for the week ended April 3 that indicates the Mortgage Bubble is definitely contracting confirming what we saw in the charts over the weekend. In spite of mortgage rates being down nearly 20 basis points that week, applications were down 4.8% and 22.8% year to year. So we're likely to see further weakness in M3 in the weeks ahead, and that should correspond with a weak stock market. The mortgage bubble was the engine of the non-recovery, and that engine has been switched off. The upturn in the 6-7 week cycle is worrisome, because that cycle can have some oomph, and the down phase of the 10-13 week cycle has been kind of timid. This may be a bear market, or it may not, but if it is, it's a damn lazy bear. Every time the bull shows up, Old Grizz just says ho hum, and goes and hibernates for awhile, until the bull wears himself out and drops of exhaustion. This is not your fathers take no prisoners bear market. No this is no bull market and maybe it's not a bear market either. Maybe its something new, a Blah market. A Blah market is one that bores everybody to death waiting for something to happen. Of course, it's not so blah for day traders and short swing traders. For them it's a Blow market, since it's blowing out both bulls and bears. The Twelfth Precept of Stock Proctology is that a market will continue what it's doing until it doesn't do it anymore. So we have to assume, until proven otherwise, that there will be no follow through on this up move either, because that's been the pattern and there's no clear sign that that's about to change. Cycle indicators continue to conflict, meaning there are some groups heading one way, and almost as many headed the other way. Doc hates to say it, but he agrees with the consensus view that there doesn't seem to be any sign that the market will soon be relieved of this constipated pattern it finds itself in.
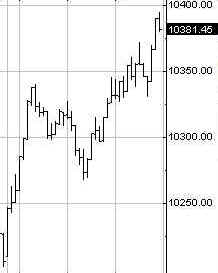
The Dow Jokes Inflatables truly were on Wednesday. The three shortest cycle waves are headed up, but the all important 10-13 week cycle indicator still points down. It's too early for an upside projection on anything but the 13 day cycle, and that points only to 10,400-425. Beyond that, at the moment, it's anyone's guess. But unless that 10-13 week cycle indicators begins to turn up, this isn't going far.
Portfolio Sphincters Index (SPX) and Sentiment The VIX closed at 20.22, down from 21.05 Tuesday, and after reaching a low of 19.01 during the day. It remains in a top zone, (inverted on chart) which has been the precursor to big declines over the past four years. Complacency remains extremely high. The 17 day rate of change, a proxy for the 6-7 week cycle, is trying to find a low, but it hasn't confirmed the upturn which was signaled on Monday by the 6-7 week cycle oscillator superimposed on the chart. Wednesday's market action was Doc's penalty for disparaging that signal yesterday. The 29 day rate of change, representing the 10-13 week cycle, looks like it has topped out, but the top isn't complete yet. Yesterday, Doc wondered whether a stronger downtrend will be established or whether the drip-drip bounce water torture would continue. Looks like water torture, it is. We're in the bounce phase. If that bounce can break the short term downtrend on Thursday, then the up phase is going to be real ugly. The blue channel lines are the extension of a linear regression channel from the February and May 2001 highs.
The cycle chart suggests the market is at a major inflection point. The 5-6 month and 10-13 week cycle indicators were weakening from low starting levels, and in the case of the 5-6 month indicator, very early. This normally suggests extended, severe weakness. But this rally off the 6 month trendline has intervened and raised a lot of questions. The short cycle oscillator whipsawed as well. It looked odd, but the 4 week cycle turned up in late March, and we knew that the 6-7 week cycle was turning up this week. So the bounce off the trendline should not have been surprising. Doc was expecting the weakening 10-13 week cycle to suppress the upturn in the 6-7 week cycle. Didn't happen, at least so far, and now we'll simply have to watch how the battle of the cycles along the 6 month trendline proceeds.
The next level up is 1136, then 1143.
The Cycle Conditions tables include cycle phase and a wild guess as to number of periods to the next turn, in days for the shortest cycles, weeks (W) or months (M) for the longer ones. This is a fluid exercise, in other words, the projections are likely to be wrong, but they force us to be vigilant for key turning points, and frequently work well enough to prevent costly misreadings of the market. SPX Cycle Conditions as of 4/10/02
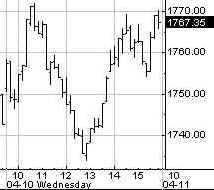
PTT - Periods Till Turn Nasgap Charts Following last week's break of the trendline, and classic return to the scene of the crime Monday, the Nas is hovering just below that trendline, with a 6-7 week cycle up phase getting going. The upside should be held in check by the down phase of the 10-13 week cycle. It's a recipe for more intraday volatility that doesn't get anywhere. The six month cycle oscillator remains in negative territory, but it is still in a weak up phase. One sharp down day will result in a sell signal, so long as a big rally doesn't surprise and intervene.
Heading down, 1699 is a 100% retracement of the February March rally. The decline since January has found support twice at a 50% retracement. If this was a low, then going up, the first fibber resistance level is at 1785, then 1815.
Nasdaq Cycle Conditions as of 4/10/02
PTT
- Periods Till Turn Sucktor Watch- Aerospace The Aerospace and Defense Stocks had a big move Wednesday and have been the beneficiary of the dangerous world we live in. This is a powerful uptrend, and the index is beginning to break through the long term channel projection. But as with the market as a whole, short cycles are conflicting. If the 10-13 week cycle indicators turn up, this could run for awhile. But it's not clear yet whether this is a top or consolidation for further gains. The 6-7 week cycle indicators are flashing buy signals. We'll keep an eye on this.
Dirty Dirty SOX Is this the beginning of a very early downturn in the 6 month spin cycle for
the dirty dirty SOX? The chart sure looks like major distribution but
they've fooled us before. Where's the darn SOX 4 and 6 week
cycle low? Perhaps right on the 6 month trendline. The SOX remains extremely
dangerous. Too many shorts are fodder for the bulls and market
makers. Stool Request Line Stock O' The Day - PVN Today's winner is Providian, sent in by stoolie "GregFokker", who also had nothing clever to say, except that he also apologized for being long the stock. (Braaaack!). You stoolies certainly have a macabre sense of humor. From 2.60 to 8.1 in 5 months. Anyone who was able to pull the trigger and go long this dog at 3 deserves whatever they get. Stock has gotten back to the top of the long term channel, and there are some signs that the rally is over, and some that say it isn't. You're on your own, buddy. (OK, so Doc is jealous.) But if I was entertaining the idea of shorting it on account of the long term channel, I'd keep it on a real short leash. Looks too early still.
I still have a few Stock'O's in the queue, but if you have an idea for one, send it to [email protected]. Include some original reason for why you think the stock is deserving. Be clever! Anything longer than 25 words- automatic disqualification! Stoolwethers Earnings tonight. Ho hum was the market's reaction. Again, conflicting cyclicality. I'm waiting for the uptrend to break decisively.
Golden Stool Over the next couple days, we may find out just how strong the uptrend in the gold stocks is. Short term sell signals have whipsawed. If the indicators remain at high levels, it's safe to conclude that these stocks are trending, and that so long as the trend is intact, they can be held. For now the indications remain bullish, but they need to be watched day by day.
Long term
bond yields are another key to telling us whether the non-recovery is about
to implode, or if inflation is going to go through the roof. This is
a critical juncture. The short
cycle on the 10 Year Treasury yield should be coming into a low, and the
intermediate wave is up. The negative divergences need to be watched. If
the intermediate momentum indicators turn down from these levels, yields
could head down back to the 5% area. On the other hand, the short term
down phase might still bottom with the intermediate uptrend intact. The
market hasn't tipped its hand yet. But if yields head lower, it will be
because of accompanying bad economic news, and that will be accompanied by
a sinking stock market as well. Uncle Buck's Illness No data
tonight to update Uncle Buck. Dr. Stepan N. Stool Let me know what you think on the Stool Pigeons Wire. Welcome To New Subscribers Welcome, and thank you for subscribing to the Anals of Stock Proctology. You may note some subtle differences in style now that this is no longer a free service. The perspective is still bearish, but it will have a more balanced approach than my message board ravings. You' won't see me screaming "BUY" about anything except perhaps gold, but you will see stronger indications of areas and times when I think it might be a good idea to avoid being short. And I promise that I will lose my temper from time to time to keep you entertained! I'll also be adding a new feature, Doc's By Request Stock O' The Day. If you have a stock you're interested in, send an email to [email protected], naming the stock, and why you think I should look at it, in 25 words or less. 26 words, and you're disqualified! Those that look interesting, I'll try to feature here within the next day or two. If you have suggestions about other features you'd like to see, send them along to [email protected]. Again, thanks for subscribing. Now, let me get to work!
|

![[Most Recent XAU from www.kitco.com]](http://www.weblinks247.com/indexes/idx24_nasdaq_en_2.gif)
![[Most Recent XAU from www.kitco.com]](http://www.weblinks247.com/indexes/idx24_sp500_en_2.gif)
![[Most Recent Quotes from www.kitco.com]](http://kitconet.com/charts/metals/gold/t24_au_en_usoz_2.gif)

 Chart Powered by METASTOCK