|
10 Minute Bar Charts 4/25/02 Dow Jokes Inflatables
Archives 12/30/01, 1/1/02, 1/2/02, 1/3/02, 1/4/02, 1/7/02, 1/8/02, 1/09/02, 1/10/02, 1/11/02, 1/14/02, 1/15/02, 1/16/02, 1/17/02, 1/18/02, 1/22/02, 1/23/02, 1/24/02, 1/25/02, 1/28/02, 1/29/02, 1/30/02, 1/31/02, 2/1/02, 2/4/02, 2/5/02, 2/06/02, 2/7/02, 2/9/02, 2/11/02, 2/12/02, 2/13/02, 2/14/02, 2/16/02, 2/19/02, 2/20/02, 2/21/02, 2/23/02, 2/25/02, 2/26/02, 2/27/02, 2/28/02, 3/1/02, 3/04/02, 3/05/02, 3/06/02, 3/7/02, 3/10/02,3/11/02, 3/12/02, 3/13/02, 3/14/02, 3/15/02, 3/18/02, 3/19/02, 3/20/02, 3/21/02, 3/22/02, 3/25/02, 3/26/02, 3/28/02, 3/30/02 4/1/02, 4/2/02, 4/3/02, 4/4/02, 4/6/02, 4/8/02, 4/9/02, 4/10/02, 4/11/02, 4/13/02, 4/15/02, 4/16/02, 4/17/02, 4/18/02, 4/20/02, 4/22/02, 4/23/02,4/24/02,4/25/02
|
The Anals of Stock ProctologyPublished 5 times
per week by the American Academy of Stock Proctology and Afternoon Outlook (4/26/02 - 1 PM Happy Acres Florida Time) Cmaps on the current move are 1676 and 1077. Current levels are 1678 and 1082. Expected low for the 1 day and 5 hour cycle is imminent as of 1 PM and it may be forming as I write this. Any rally should be small and short lived. The 8 day cycle up phase has failed. The 13 day cycle appears to be in control. Cmaps for the 13 day cycle based on the hourly charts are SPX 1060-75 and Nas 1650-70. That could happen at any time between now and Tuesday. It is also possible that if the decline is sharp enough now the targets for the 1 day cycle could adjust down. Continue to monitor. 11 AM Update- Cmaps on this move are 1670 and 1077. The low is due between 12 and 1 PM. This is in the range of the daily cmaps, which may adjust down on end of day charts if there's no recovery in PM. Stay tuned for 1 PM update. Pre Market Outlook (4/26/02)- Nothing Dramatic The market returned to that 3-4 hour cycle we've seen from time to time. That cycle was rising at the bell. The peak is due today at 10:30. The low should be on either side of 1 PM. Look for the 1 day cycle high around 2 PM, with weakness in the late PM. On the hourly charts the 8 day cycle is in day 2 of what is, so far, a weak up phase, known to stoolies as a swup. Assuming longer cycles have not turned up, the peak in the 8 day cycle is due today on the SPX and tomorrow on the SPX. Upside cmaps on the 1 day cycle are murky, but appear to be around 1720-25 and 1094. The 1 day cmap on the SPX fucutures is 1097, and 1320 on the Nas 100's both of which were hit already. There does not appear to be anything dramatic here. At 9 AM, the fucutures are backing down and are back to where they were at the GDP announcement. As one of the stoolies said yesterday, if the corpses can't grow profits with 6% GDP growth, that's not too good. AM Updates Below Uncle
Buck No Feed, No Jam (4/25/02) There was lots of concern about the $10.5 billion Feed today. The concern is misplaced. $5 billion of that was a rollover of a $5 billion 28 day repo from March 28. $2.5 billion rolled the prior day's overnight repo, and another $1 billion replaced a maturing T-bill held by the Fed. That left about a $2 billion net gain, all in an overnight repo. Considering how inactive the Fed was this week, that's not going to be enough to jam the market. The weekly data released by the Fed today confirms what we saw all week - that they've been downright stingy. Factors supplying reserve funds dropped by $3.6 billion and overall reserve balances at the Fed dropped by $4.4 billion. That data is through Wednesday. Thursday's net add of $2 billion falls short of covering even that. The adjusted Monetary Base chart below reflects Fed data through April 17. Next week the Fed will release the monetary base data through May 1. Unless they get a lot more aggressive in the week ahead, the decline will continue. Over the next two weeks, about $25 billion in repos and $17 billion in permanent paper will mature. That means the Fed will need to add an average of $4.2 billion per day to just stay even. Keep that in mind as you watch the daily Feeds. Just remember that a couple billion here and a couple billion there is nothing, and won't push the market up.
M1 and total deposits were
down in the week ended April 15, no surprise there. The drop moderated
from the prior week. Growth since mid December has been negative. A lot of
people are expecting a big GDP number tomorrow. If money supply is any
indication, the surprise will be to the downside, which is likely to
really spook the sphincters who were counting on an enormous increase to
buttress the V shaped recovery bullcrap. Should be fun to watch. Here's another nice broad
measure of money, similar to M-3 but without the large time deposits. Down
yet again, and flat since year end. The champagne credit bubble machine
isn't pumping up the bubble so much any more and suddenly there's not
enough to go around. As a result, stocks are slowly but surely becoming
the investment of last resort, likely to return to the honored place they
had in America's heart back in the seventies. In other words, mass
hatred. The champagne money bubble
machine is the GSE mortgage refi bubble which is steadily winding down.
Even last week's continuing sharp drop in mortgage rates failed to
stimulate much in the way of mortgage demand. Demand has been sated. Without
those refi's the system will slowly wither away. Dow Inflatables
Portfolio Sphincters Index (SPX) and Sentiment The SPX was down 1.66. The 17 day rate of change, a proxy for the 6-7 week cycle, is in double bottom. The 6-7 week cycle oscillator superimposed on the chart has started to roll over but there's no sell signal yet. Late sell signals are usually extremely bearish, but caution is advisable here. The 29 day rate of change, representing the 10-13 week cycle, is at the same level from which it turned up in February. We need to keep a close eye on these indicators. If they continue down together they will confirm the downtrend. If they should turn up, it means further delay for bears. Short term centered moving average projections inched up, ranging from 1070 to 1090. The lack of follow through today probably means this isn't the Big One. The VIX closed at 23.05, up from 22.68. Option volatility is slowly increasing, but still low, indicating relatively high complacency. On the inverted scale chart, VIX has dropped out of the top band, indicating that the big decline we've been looking for is probably under way. The last big short term rally came from the 27-28 area, and a big intermediate swing rally probably won't come until the index is well above 30. Any upside from current levels would be limited and unsustainable. The blue channel lines are the extension of a linear regression channel from the February and May 2001 highs.
The 5-6 month cycle oscillator has begun to move down, but other cycles look reluctant to get in gear. The 10-13 week cycle could bottom at any time over the next 3 weeks, with the current projection no lower than 1070. If this is going to be the Big One, a sharp break will need to happen soon, like right now.
Fibo support levels are 1090 and 1075-80, then 1062 and so on.
The Cycle Conditions tables include cycle phase and a wild guess as to number of periods to the next turn, in days for the shortest cycles, weeks (W) or months (M) for the longer ones. This is a fluid exercise, in other words, the projections are likely to be wrong, but they force us to be vigilant for key turning points, and frequently work well enough to prevent costly misreadings. SPX Cycle Conditions as of 4/25/02
PTT - Periods Till Turn Nasgap Charts The Nas was virtually unchanged at a round number and possible cycle edge band support level. The short cycle oscillator is in the bottom zone, so it may be time for a bounce. This is either an early bottom to the 10-13 week cycle or the beginning of a breakdown from yet another gigantic distributional top. The 5-6 month cycle oscillator is on the verge of a downturn from below neutral, usually a sign of impending disaster. The 8 and 13 day cycles are still a question mark. The 8 day cycle low may have been today, and it could generate a bounce, but it would be temporary. The centered moving average projection for that cycle still points at 1650. There's enough ambiguity in the short run to make both bulls and bears nervous.
Fibo support levels are at 1699, which is the old low, and 1660.
Nasdaq Cycle Conditions as of 4/25/02
PTT
- Periods Till Turn Bonds
spent the day selling off after a strong open. Bond yields ended nearly
unchanged. While the uptrend was broken, perhaps it's going to resume at a
slower rate. The inflation-deflation saga continues with the outcome
still not determined.
Check the AM edition for these features: Sucktor Watch -Dirty Dirty SOX It's
decision time for SOX. Indicators are parked in neutral, with the index
resting at downtrending support. A downturn from here would complete
months of distribution. An upturn would signal yet more of the interminable
churning. This type of pattern is showing up in many sectors. Stoolwethers- General Custer There are
hints that the General may finally be getting close to his last stand.
Cycle oscillators have reached bottoming zones. But the final days of a downtrend
are also the period of greatest downside vulnerability. The short cycle
ozzie should turn down one more time, and that could send GE below 30. FNM The long
term spreading of Fannie continues. The stock has not done well in the
last few weeks in spite of declining mortgage rates. The bubble is
receding and all signs are negative. Stock O' The Day- Bubble Bubble Toil and Trouble Doc thought it would be a good time to revisit NVR which shows no sign of departing from its uptrend yet. Here's the problem. April 15 short interest was 618,000 shares, with average daily volume of 159,000 shares. Ruh-RO! 68% of the 7.5 million shares are in institutional hands. 25% of the shares in non-institutional hands are held short. The squeeze continues.
If you have an idea for a Stock O', send it to [email protected]. Include some original reason for why you think the stock is deserving. Be clever! Anything longer than 25 words- automatic disqualification! And please, no penny stocks. Feel free to request follow-ups too. Uncle Buck's Illness
R.I.P. Buck. We're sure gonna miss you. Buck rallied overnight and this
morning is back to 115.60, at the bottom end of its short term regression
channel. Golden Stool Gold stocks went for the gold but didn't make it. Was the false breakout a classic WHOPsaw, stranding those who bought the breakout, or is it just a matter of time before those buyers get redemption. Doc think's that when the cycle stoolicators and 6-7 week cycle mo turn up, these stocks are really going to fly.
See you in Intraday Stool. Dr. Stepan N. Stool Let me know what you think on the Stool Pigeons Wire. Welcome To New Subscribers Welcome, and thank you for subscribing to the Anals of Stock Proctology. You may note some subtle differences in style now that this is no longer a free service. The perspective is still bearish, but it will have a more balanced approach than my message board ravings. You won't see me screaming "BUY" about anything except perhaps gold, but you will see stronger indications of areas and times when I think it might be a good idea to avoid being short. And I promise that I will lose my temper from time to time to keep you entertained! There's also a new feature, Doc's By Request Stock O' The Day. If you have a stock you're interested in, send an email to [email protected], naming the stock, and why you think Doc should look at it, in 25 words or less. 26 words, and you're disqualified! Those that look interesting, Doc will try to feature here within the next day or two. If you have suggestions about other features you'd like to see, send them along to [email protected]. Again, thanks for subscribing!
Explanation of Intraday Commentary-Build charts at http://www.livecharts.com. For custom time bars insert a comma after symbol and number of minutes, e.g. compx,90. This will give you a bar chart of the Nas with 90 minutes per bar. The one day cycle is usually most clear with 8 minute bars and 26/18 stochastics. It varies from day to day. Sometimes 6 minutes works best. Experiment to find the best fit for your trading style, and the market's dominant frequency at the time. The goal here is primarily to monitor the condition of the 8 and 13 day cycles. I typically use 90 minute bars with 26/18 stochastics for the 13 day cycle proxy on the indices during regular trading hours. Other cycles use 26/18 stochastics with the following: 8 days- 60 minute bars On the 24 hour futures charts, use a time per bar approximately 3 to 4 times the above number of minutes, to represent the cycles listed above. ABBREVIATIONS: cma: centered moving average |
![[Most Recent XAU from www.kitco.com]](http://www.weblinks247.com/indexes/idx24_nasdaq_en_2.gif)
![[Most Recent XAU from www.kitco.com]](http://www.weblinks247.com/indexes/idx24_sp500_en_2.gif)
![[Most Recent Quotes from www.kitco.com]](http://kitconet.com/charts/metals/gold/t24_au_en_usoz_2.gif)
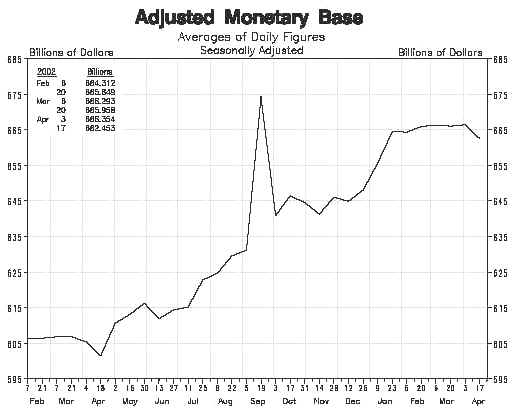
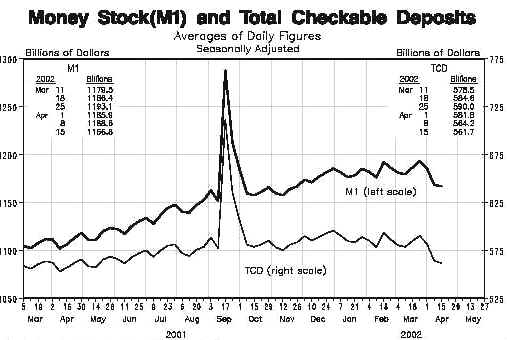
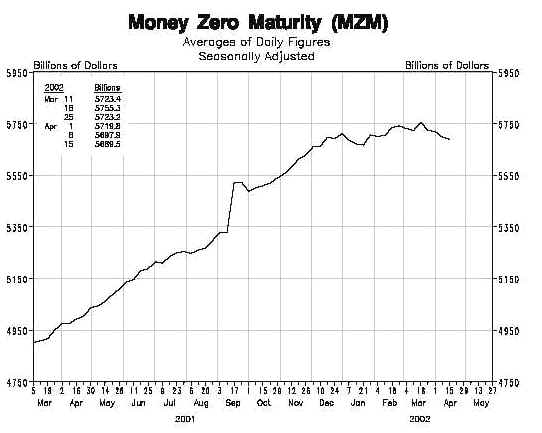

 Chart Powered by METASTOCK