|
10 Minute Bar Charts 4/29/02 Dow Jokes Inflatables
Archives 12/30/01, 1/1/02, 1/2/02, 1/3/02, 1/4/02, 1/7/02, 1/8/02, 1/09/02, 1/10/02, 1/11/02, 1/14/02, 1/15/02, 1/16/02, 1/17/02, 1/18/02, 1/22/02, 1/23/02, 1/24/02, 1/25/02, 1/28/02, 1/29/02, 1/30/02, 1/31/02, 2/1/02, 2/4/02, 2/5/02, 2/06/02, 2/7/02, 2/9/02, 2/11/02, 2/12/02, 2/13/02, 2/14/02, 2/16/02, 2/19/02, 2/20/02, 2/21/02, 2/23/02, 2/25/02, 2/26/02, 2/27/02, 2/28/02, 3/1/02, 3/04/02, 3/05/02, 3/06/02, 3/7/02, 3/10/02,3/11/02, 3/12/02, 3/13/02, 3/14/02, 3/15/02, 3/18/02, 3/19/02, 3/20/02, 3/21/02, 3/22/02, 3/25/02, 3/26/02, 3/28/02, 3/30/02 4/1/02, 4/2/02, 4/3/02, 4/4/02, 4/6/02, 4/8/02, 4/9/02, 4/10/02, 4/11/02, 4/13/02, 4/15/02, 4/16/02, 4/17/02, 4/18/02, 4/20/02, 4/22/02, 4/23/02,4/24/02,4/25/02, 4/26/02, 4/27/02
|
The Anals of Stock ProctologyPublished 5 times
per week by the American Academy of Stock Proctology and PM Outlook (4/30/02) All that bearish giddiness yesterday gave Doc a bad feeling. Now we know why. The 13 day cycle turned up this morning in a classic bear shooting rallies. Now we're in the midst of a 5 hour cycle pullback, with a low due at 1 PM and a 1 day cycle low due between 2 and 3 PM. The 13 day cycle should be in an up phase until Friday. There's a preliminary cmap of 1710 on the 8 day cycle projection for the Nas and 1089 on the SPX. Those will change, but up or down, we don't know. On the 1 day cycle they're 1695 and 1084. We hit those, so the worst is over for now and the afternoon should see a pullback within the context of a 13 day cycle swup. They should rally again in the last hour. Obviously there were still too many shorts out there, but are there fewer now? Pre Market Outlook (4/30/02) The Nas bounced in the last half hour yesterday. The rest of the market just sat there looking stunned. Bears were getting pretty giddy in the afternoon. When bears get overconfident, it's usually not a good sign (for us bears). Today is also the day when the 13 day cycle low comes due. One day cycle cmaps are 1061 on the SPX and 1647. The SPX got close. The Nas exceeded that target. The 13 day cmaps were 1067 on the SPX and 1650 on the Nas. Both of those were hit. If the 13 day low isn't already in, it's in the process of forming. The 5 hour and 1 day cycle highs appear to be due around 10 AM and 11 AM. Then we watch the pullback. If the lows hold, it's probably safe to conclude a 13 day cycle swup is getting under way, lasting until Friday. After rallying through the night fucutures took a dip around 8:30 AM and are in a down phase on the 1 day cycle. However, they held above yesterdays lows and should have no impact. Deja Vu (4/29/02) Stoolies
who have been around for awhile may be getting a sense of deja vu.
Doc had the eerie feeling that he was back in the summer of '74 - day
after day of relentless downtrending on light volume. It wasn't so much
that the market went down on heavy selling. In fact quite the opposite. It
was that there was just no buying. The public hated stocks after years of
negative returns. The only difference was that then it had been going on
for eight years. This time around. it's only been a little over two years.
Then for the next 5 years, the market would rally for 6- 9 months, only to get smashed yet again to lower lows, until finally everybody gave up and went away for ten years. The base of the next great bull market was built during the years between 1974 and 1982 when nobody was around, and the market pretty much did nothing. That's how history says it will work again this time. Meanwhile the poodits are still talking about how earnings are improving. That's all they ever talk about. They just don't get it. See, it's about the pendulum swinging, about the fact that nobody in their right mind is going to want to put money into stocks again for another 15-20 years. About the fact that most of the world is waiting for prices to rise just so they can get out. Unfortunately for them, the market is never that kind. Because the next time the averages get to the levels those folks are waiting for, it won't be the same stocks. It will be a whole different group with few exceptions. Companies are born, they grow, they mature, they get old, and they die. It's the same with industries, and technologies, and markets. This market was born in 1982. It grew through the mid nineties. It got old in the late nineties, and now it's dying. Dying a long, slow miserable death. Sure, it'll go into remission for months at a time, but this is a long long way from the end, a long way from capitulation. Capitulation is when nobody gives a crap anymore. Capitulation lasts for years. The poodits talk about capitulation like it's some kind of magic bullet. They couldn't be more wrong. You know when capitulation will be? Capitulation will be when Crapvision goes off the air because nobody's watching any more. As long as Maria's there asking day in and day out if this is capitulation, that alone is living proof that this thing is a long long way from over. The Feed added $7.5 billion today in a 3 day repo. That rolled over a $6 billion weekend repo and added $1.5 billion. the also did a $472 million coupon pass. Was that a jam? Not quite. $7.6 billion in permanent paper matures tomorrow (Tuesday). Today's temporary operation was probably preparation for that. So let's see what they do. Dow Inflatables
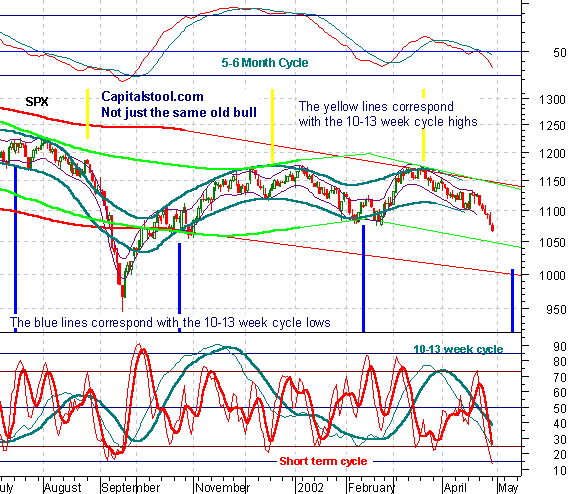
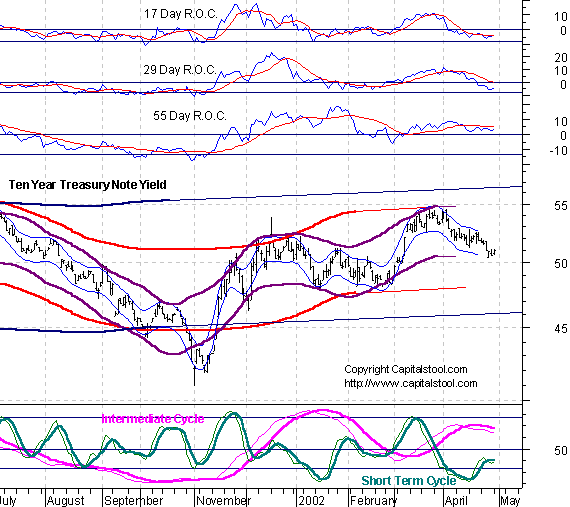
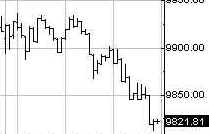
Portfolio Sphincters Index (SPX) and Sentiment The SPX was down 11 to 1065, returning the index to the center of a linear regression channel that's been established for 15 months. The 17 day rate of change, a proxy for the 6-7 week cycle, remains at the same level from which the last two market bounces sprang. If it breaks lower from here, the decline is likely to accelerate. The 6-7 week cycle oscillator superimposed on the chart has started to roll over very late. Late sell signals are usually extremely bearish. The 29 day rate of change, representing the 10-13 week cycle, is below the level from which it turned up in February. Further downside from here may signal downside acceleration. A 10-13 week cycle low is due within the next 13 days. An upturn in the oscillator should be respected as a 10-13 week cycle upturn. Short term centered moving average projections moved down, with near term projections of 1050 due within 2 days. The index broke the lower trendline of the short term linear regression channel. This is where it gets real tricky. A lot of damage can be done in 2 days, especially if the downtrend accelerates, but by the same token, upturns can be sudden and can lead to one of those patented bear shooting rallies. The VIX closed at 26.11, a big jump from Friday's 24.64. On the inverted scale chart, VIX has now dropped to the lower portion of the stool band. The bottom zone begins near the 28 level. The last big short term rally came from the 27-28 area, but a big intermediate swing rally probably won't come until the index is well above 30. The blue channel lines are the extension of a linear regression channel from the February and May 2001 highs.
The 5-6 month cycle oscillator has turned decisively lower with shorter cycles now in gear. The 10-13 week cycle could bottom at any time over the next 3 weeks, with the current projection now 1050. The short cycle oscillator is at the lowest level since early September, showing a market that is extraordinarily weak, but one that could bounce at any time. The poodits will now be singing the Dover Sole song. As all stoolies know, there's no such thing as Dover Sole in a bear market.
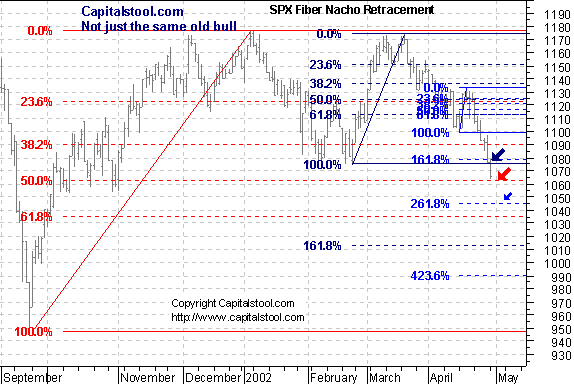
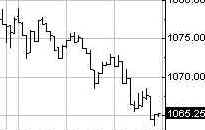
Fibo support at 1075-80, the February low, broke. 1062 is a 50% correction of the September-January rally. 1045 is a minor level, then 1035.
The Cycle Conditions tables include cycle phase and a wild guess as to number of periods to the next turn, in days for the shortest cycles, weeks (W) or months (M) for the longer ones. This is a fluid exercise, in other words, the projections are likely to be wrong, but they force us to be vigilant for key turning points, and frequently work well enough to prevent costly misreadings. SPX Cycle Conditions as of 4/29/02
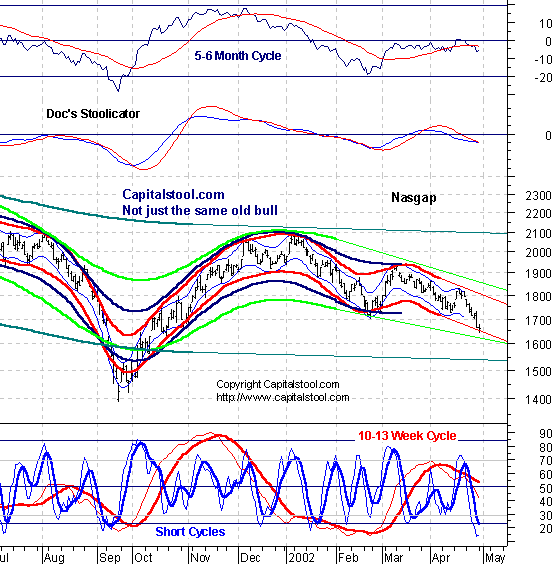
PTT - Periods Till Turn Nasgap Charts The Nas only lost 7 as it hovered near the bottom of a cycle wave projection. Will we see a return to the scene of the crime rally, or break the cycle wave down even more steeply? The short cycle oscillator is still at the lowest level it's been since the bear market began, below even September. This is a powerful decline, and while it may bounce soon, there's no sign of a real bottom. The 5-6 month cycle oscillator has made a downturn from below neutral, usually a sign of impending disaster. The 13 day cycle appears to be back. A low is due on Tuesday. The centered moving average projection for that cycle now points at 1620. With all other cycles in gear to the downside, the upturn in the 13 is likely to be weak and brief, with projections for longer cycles all 50 to 100 points lower.
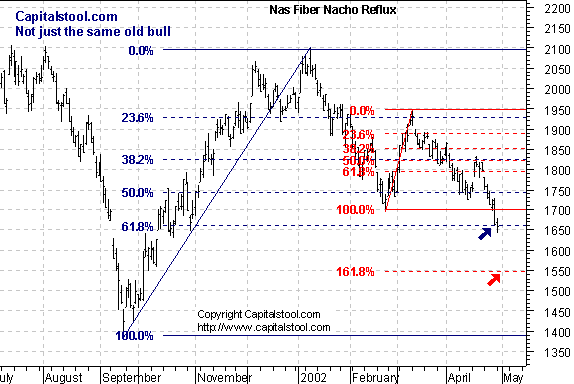
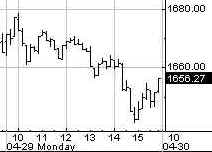
Fibo support levels are at 1660, and 1550. They tried to hold at 1660 today.
Nasdaq Cycle Conditions as of 4/29/02
PTT
- Periods Till Turn Bonds sold off, sending yields
higher. Oscillators are poised for an upturn. If they do so before yield
breaks below 5%, the uptrend is confirmed, although at a slower
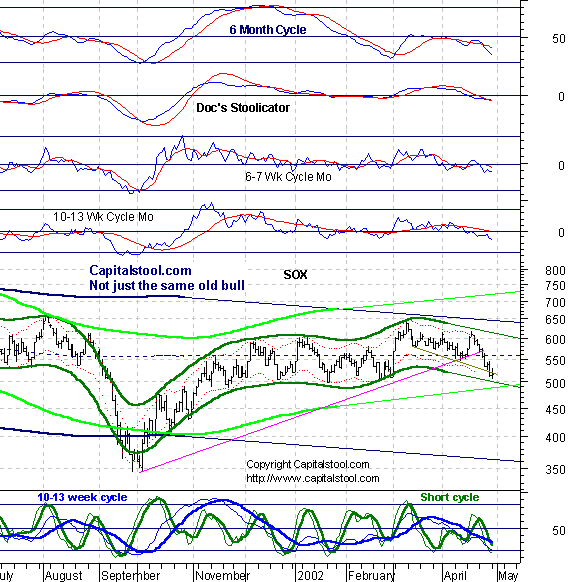
rate. Sucktor Watch - Dirty Dirty SOX The SOX is approaching key support at 490-500 and the 10-13 week cycle oscillator is coming into a bottoming zone. The short cycle oscillators are still pointing down, but look for a bottom to develop over the next few days. There are still too many shorts in this group to allow it to drop in a straight line.
Retail The Retail Index was the darling of the poodits for the last six months. That's coming to an end. This looks like a major top. Once the index breaks the neckline in the 910 area, the reversal will be confirmed. The bottom sniffers are likely to bounce it first.
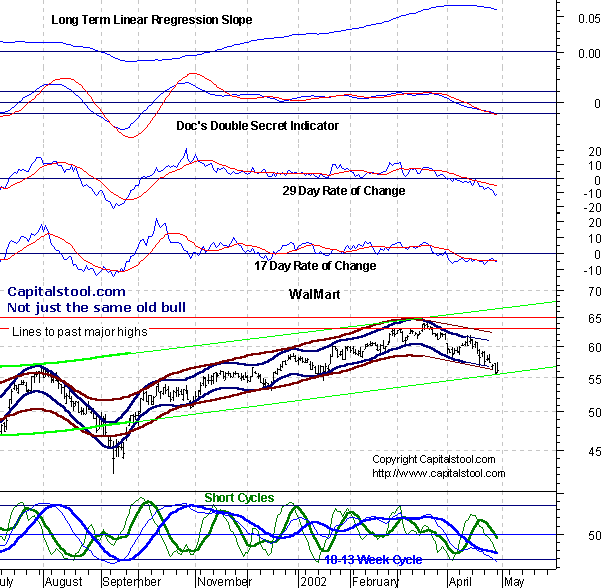
Stoolwethers - Wally's Department Store Wally World is back to a level formerly known as support as it builds a really gorgeous hunchback formation. Doc is seeing returns to levels formerly known as support in a lot of Stoolwethers. The 10-13 week cycle oscillator is also getting down into a bottoming zone in many of them. Watch for portfolio sphincters to do some bottom picking in the days ahead. We'll probably get one more bounce before they break this market down for good.
Stock O' The Day- WMS Today's Stock 'O is Williams Sonoma, was sent in by Alan. Yet another one of those pictures of a powerful uptrend. (Doc won't short a stock until it has established a downtrend and has rallied to a resistance level.) The stock is bumping its head against upper cycle channel projections, and it may be ready to consolidate as the 6-7 week cycle tops out, but there's no sign the stock is ready to come down in a meaningful way. A 7-8 point pullback is probably the best that can be expected - when it starts, and there's no sign of that yet. Doc will try to follow up on this in a few weeks.
If you have an idea for a Stock O', send it to [email protected]. Include some original reason for why you think the stock is deserving. Be clever! Anything longer than 25 words- automatic disqualification! And please, no penny stocks. Feel free to request follow-ups too. Uncle Buck's Illness
As Uncle Buck sinks slowly in the west, the only question is whether he'll
pause in the 114 area formerly known as support or just sink like a stone
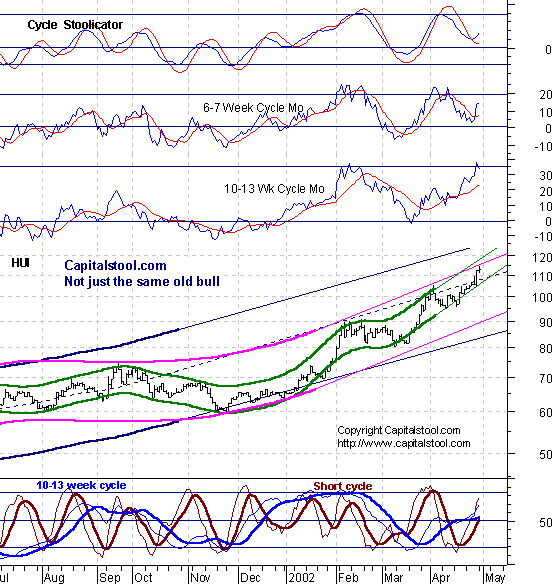
all the way to 111. Golden Stool The uptrend is still intact in the gold stocks. There are early signs that a new consolidation is near, with the 10-13 week cycle momentum at the level it reached at the February high. Other than that, all systems are still go.
Dr. Stepan N. Stool Let me know what you think on the Stool Pigeons Wire. Previous complete issue with all features Welcome To New Subscribers Welcome, and thank you for subscribing to the Anals of Stock Proctology. You may note some subtle differences in style now that this is no longer a free service. The perspective is still bearish, but it will have a more balanced approach than my message board ravings. You won't see me screaming "BUY" about anything except perhaps gold, but you will see stronger indications of areas and times when I think it might be a good idea to avoid being short. And I promise that I will lose my temper from time to time to keep you entertained! There's also a new feature, Doc's By Request Stock O' The Day. If you have a stock you're interested in, send an email to [email protected], naming the stock, and why you think Doc should look at it, in 25 words or less. 26 words, and you're disqualified! Those that look interesting, Doc will try to feature here within the next day or two. If you have suggestions about other features you'd like to see, send them along to [email protected]. Again, thanks for subscribing!
Explanation of Intraday Commentary-Build charts at http://www.livecharts.com. For custom time bars insert a comma after symbol and number of minutes, e.g. compx,90. This will give you a bar chart of the Nas with 90 minutes per bar. The one day cycle is usually most clear with 8 minute bars and 26/18 stochastics. It varies from day to day. Sometimes 6 minutes works best. Experiment to find the best fit for your trading style, and the market's dominant frequency at the time. The goal here is primarily to monitor the condition of the 8 and 13 day cycles. I typically use 90 minute bars with 26/18 stochastics for the 13 day cycle proxy on the indices during regular trading hours. Other cycles use 26/18 stochastics with the following: 8 days- 60 minute bars On the 24 hour futures charts, use a time per bar approximately 3 to 4 times the above number of minutes, to represent the cycles listed above. ABBREVIATIONS: cma: centered moving average |
![[Most Recent XAU from www.kitco.com]](http://www.weblinks247.com/indexes/idx24_nasdaq_en_2.gif)
![[Most Recent XAU from www.kitco.com]](http://www.weblinks247.com/indexes/idx24_sp500_en_2.gif)
![[Most Recent Quotes from www.kitco.com]](http://kitconet.com/charts/metals/gold/t24_au_en_usoz_2.gif)
 So maybe it's
only 1969. Do you remember 1969? One of the worst years of all time.
Relentless, seemingly never ending, decline after decline, interrupted a
couple of times by hope-feeding rallies. That's what this feels
like.
So maybe it's
only 1969. Do you remember 1969? One of the worst years of all time.
Relentless, seemingly never ending, decline after decline, interrupted a
couple of times by hope-feeding rallies. That's what this feels
like. 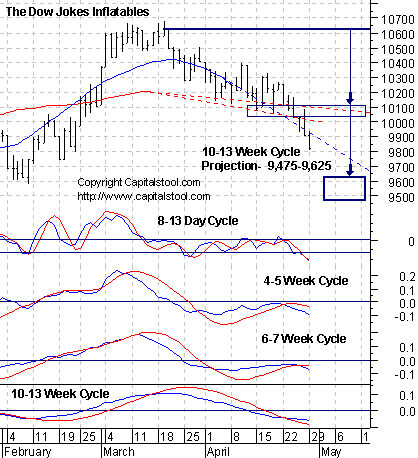 The
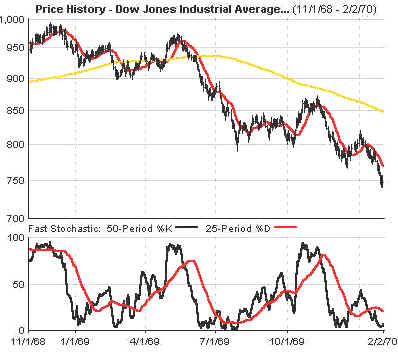
Dow Inflatables broke down another 90 points putting more distance between
it and the consolidation area above 10,000. The 8-13 day, 4-5 week
and 6-7 week cycle oscillators declined again, reaffirming the
trend. The 10-13 week cycle oscillator is above its smoother, but
both continue to decline. The downtrend is still fully confirmed in spite
of the fact that the Dow is within its 10-13 week cycle low window. The centered moving average projection for this cycle moved down
again, this time to 9,475-9,625, which is in line with the measuring
implication of the consolidation area.
The
Dow Inflatables broke down another 90 points putting more distance between
it and the consolidation area above 10,000. The 8-13 day, 4-5 week
and 6-7 week cycle oscillators declined again, reaffirming the
trend. The 10-13 week cycle oscillator is above its smoother, but
both continue to decline. The downtrend is still fully confirmed in spite
of the fact that the Dow is within its 10-13 week cycle low window. The centered moving average projection for this cycle moved down
again, this time to 9,475-9,625, which is in line with the measuring
implication of the consolidation area. 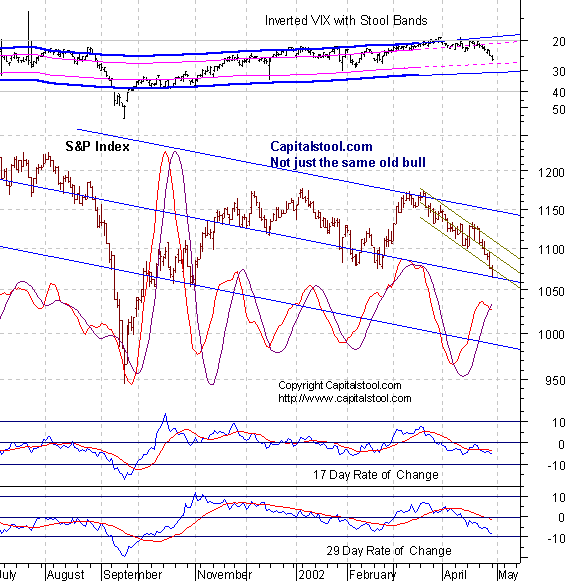
 Chart Powered by METASTOCK