|
10 Minute Bar Charts 4/01/02 Dow Jokes Inflatables
Archives 12/30/01, 1/1/02, 1/2/02, 1/3/02, 1/4/02, 1/7/02, 1/8/02, 1/09/02, 1/10/02, 1/11/02, 1/14/02, 1/15/02, 1/16/02, 1/17/02, 1/18/02, 1/22/02, 1/23/02, 1/24/02, 1/25/02, 1/28/02, 1/29/02, 1/30/02, 1/31/02, 2/1/02, 2/4/02, 2/5/02, 2/06/02, 2/7/02, 2/9/02, 2/11/02, 2/12/02, 2/13/02, 2/14/02, 2/16/02, 2/19/02, 2/20/02, 2/21/02, 2/23/02, 2/25/02, 2/26/02, 2/27/02, 2/28/02, 3/1/02, 3/04/02, 3/05/02, 3/06/02, 3/7/02, 3/10/02,3/11/02, 3/12/02, 3/13/02, 3/14/02, 3/15/02, 3/18/02, 3/19/02, 3/20/02, 3/21/02, 3/22/02, 3/25/02, 3/26/02, 3/28/02, 3/30/02
|
The Anals of Stock ProctologyPublished 5 times
per week by the American Academy of Stock Proctology and Welcome, and thank you for being a founding subscriber to the Anals of Stock Proctology. You may note some subtle differences in style now that this is no longer a free service. The perspective is still bearish, but it will have a more balanced approach, than my message board ravings. You' won't see me screaming "BUY" about anything except perhaps gold, but you will see stronger indications of areas and times when I think it might be a good idea to avoid being short. And I promise that I will lose my temper from time to time to keep you entertained! I'll also be adding a new feature, Doc's By Request Stock O' The Day. If you have a stock you're interested in, send an email to [email protected], naming the stock, and why you think I should look at it, in 25 words or less. 26 wwords, and you're disqualified! Those that look interesting, I'll try to feature here within the next day or two. If you have suggestions about other features you'd like to see, send them along to [email protected]. Again, thanks for subscribing. Now, let me get to work! Irrational Exuberance Lives! ( 4/01/02) No surprise, the market sold off at the open in response to the horrific events in the Middle East. Then it gradually found its footing, and went on a tear late in the afternoon. Another massive short squeeze in the Nasgap triggered the panic. Make no mistake, the market's stage managers know how to hit 'em right between the legs. And shortsellers are in no mood to stick around to bear the pain. When they saw that double bottom form four days apart on the charts, it was, "Outta here!" Meanwhile, Bonk of America added fuel to the fire by borking the semiconductor stocks. How often have we seen this lately. Jeez, they're all on the bandwagon. Who knows what those analcysts see? DRAM prices have been slipping for a couple of months, with 128 meg PC 133 now trading at $3.27. DRAM Prices are down 20% in March. But none of that matters because, as we all know, stocks trade independently of funny mentals. There is a shortage of semiconductor stocks because of the enormous short interest. See, in this world, if you're right, you're wrong, because you have too much company, even though you're right. For more on that group, see below.
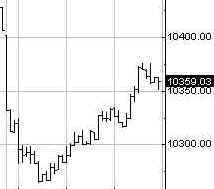
The Dow Inflatables didn't float as well as the rest of the market Monday because not that many people are that wild about shorting the Dow. So the big boys weren't being bought like the Nasgap crap. The Dow is range bound, with the 13 day, 4 and 6 week cycles due to turn up, and the 10-13 week cycle topping out. I see no reason to expect the Dow to break out of this 10300-10,500 range for awhile. For the next week or so, the bias would appear to be to the upside. We'll see.
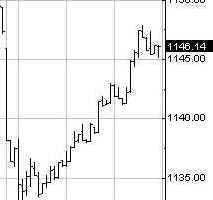
Portfolio Sphincters Index (SPX) and Sentiment The VIX closed at 20.05, up from 19.03 Friday. It remains near its lowest level since August 31, 2000. The SPX dropped 15% in the 6 weeks following that reading, after staying below 20 with the market churning for 2 weeks. The index has been at or below 20 for a week and a half now. Can we rely on the precedent? The indicator has only "worked" for four years. Four years is not much history. But the level of animal spirits seems to match what's going in with this indicator. Price, and price based indicators are always the final arbiter. Negative divergences in intermediate indicators have persisted. If the market turns down before the divergences are resolved, the rallies are simply distribution. That is Wall Street's business, and they are masters of it. The 17 day rate of change, a proxy for the 6-7 week cycle, is headed down, but there's no thrust to the downside, and this cycle is due to bottom any day. The four week cycle already has. The 29 day rate of change, representing the 10-13 week cycle, remains on the cusp of a sell signal, but as long as it continues to creep higher, the assumption is that the up phase, or at least the top, is not yet complete. Wall Street thinks that the market is in a bull market correction or consolidation. Looking at the linear regression channel going back to the January 2001 high gives a different impression. Even churning up to the 1155-60 area, where some centered moving average projections are pointing now, wouldn't change that.
This is a critical juncture on the cycle chart. Intermediate cycle indicators have begun to turn down at relatively low levels. A downturn from these levels normally indicates severe weakness ahead. On the other hand, a whipsaw may indicate more weeks of upside. We'll worry about that if it occurs. The 1 year cycle up phase has been under way since the September 2001 lows, and is now completing a second top. The top building process usually takes weeks. This one has been under way for a month, and with all the cycle juxtaposition, it may stay here for another few weeks. I still think time is on the side of the bears, but based on the position of the short cycle oscillators, an up phase lasting one to three weeks looks likely to intervene before the top is complete.
1153 is a 50 % retracement of the decline, while 1135 is a 38.2 % retracement of the prior rally from 1080. The next level to the upside is 61.8% at about 1158.
The Cycle Conditions tables include cycle phase and a wild guess as to number of periods to the next turn, in days for the shortest cycles, weeks (W) or months (M) for the longer ones. This is a fluid exercise, in other words, the projections are likely to be wrong, but they force us to be vigilant for key turning points, and frequently work well enough to prevent costly misreadings of the market. SPX Cycle Conditions as of 4/1/02
PTT - Periods Till Turn Nasgap Charts Short cycles have come off the low. The market will continue to bounce or range rattle before the intermediate top is complete and the 6 month cycle oscillator turns down. The six month cycle oscillator remains weak in negative territory, and precariously close to a sell signal, but close is no cigar. It indicates a weak up phase, and it will be a precursor to complete collapse if the indicator turns down without further improvement from here. Obviously there are a few "ifs" in there, and its best to wait for a definitive signal. The danger is that it could get ugly to the upside for a few days.
The next fib levels on the rally are 1877 and 1884. If it breaks above that forget it. It'll go all the way to retest the high.
Nasdaq Cycle Conditions as of 4/1/02
PTT
- Periods Till Turn Sucktor Watch- The Dirty SOX The dirty, dirty SOX was off to the races again Monday. The price chart continues to look bullish, but cycles and momentum are mixed. My highly technical view of things tells me that if the little blue lines cross above the little red lines over the next 2-3 days, then we're going to be looking at 700. On the other hand, if they can drop below their current neutral readings, the uptrend is over. I know this is important to many of you, so I'll report on this regularly.
Stoolwethers Interesting what a couple of reverse borkings by major borkers can do. UBSWhoreburg (sorry to U BSers, I can't help myself) and Mohel Lynch (Oy, do we got tips for you!)(ditto) downgraded dear old Sam's place, creating a nifty little reversal pattern. Now, why in the world would that make me suspicious. OK, when was the last time a borker downgraded a stock at the top? The only time they downgrade a stock is either after it's too late, or if they're trying to accumulate it. Be that as it may, this looks like a short term low within an intermediate downturn. And why the hell would anyone give a damn? The stock only moves 5 points every thee months. In fact, why am I even writing about it? Think about it this way, selling in this behemoth creates a ton of liquidity for the borkers to play with. So its important to that extent, and to the extent that its a market stoolwether. If this stock is acting puny, the market's not going far.
Golden Stool Ah the gold stocks! Measures of the 10-13 week cycle are early in the up phase. Short cycles are toppy and need to consolidate however. That could be just a sideways move. This still looks like a very powerful intermediate up phase, in the early stages of a long term secular bull market in gold. Up around the 110 level might be a time to take profits, but I'm inclined to hold and see how it acts if and when it gets there.
Bond yields may be ready to break out again. The short cycle is coming into a low over the next few days, and the intermediate wave is solidly up. It's not a given, but a move coming out of this configuration has the potential to be explosive.
Uncle Buck's Illness Uncle Buck fell down today after getting out of bed last week. We'll continue to watch by his hospital bed. Tell the family to stay near the phone.
See you in Intraday Stool. Dr. Stepan N. Stool Let me know what you think on the Stool Pigeons Wire.
|
![[Most Recent XAU from www.kitco.com]](http://www.weblinks247.com/indexes/idx24_nasdaq_en_2.gif)
![[Most Recent XAU from www.kitco.com]](http://www.weblinks247.com/indexes/idx24_sp500_en_2.gif)

 Chart Powered by METASTOCK