|
10 Minute Bar Charts 4/18/02 Dow Jokes Inflatables
Archives 12/30/01, 1/1/02, 1/2/02, 1/3/02, 1/4/02, 1/7/02, 1/8/02, 1/09/02, 1/10/02, 1/11/02, 1/14/02, 1/15/02, 1/16/02, 1/17/02, 1/18/02, 1/22/02, 1/23/02, 1/24/02, 1/25/02, 1/28/02, 1/29/02, 1/30/02, 1/31/02, 2/1/02, 2/4/02, 2/5/02, 2/06/02, 2/7/02, 2/9/02, 2/11/02, 2/12/02, 2/13/02, 2/14/02, 2/16/02, 2/19/02, 2/20/02, 2/21/02, 2/23/02, 2/25/02, 2/26/02, 2/27/02, 2/28/02, 3/1/02, 3/04/02, 3/05/02, 3/06/02, 3/7/02, 3/10/02,3/11/02, 3/12/02, 3/13/02, 3/14/02, 3/15/02, 3/18/02, 3/19/02, 3/20/02, 3/21/02, 3/22/02, 3/25/02, 3/26/02, 3/28/02, 3/30/02 4/1/02, 4/2/02, 4/3/02, 4/4/02, 4/6/02, 4/8/02, 4/9/02, 4/10/02, 4/11/02, 4/13/02, 4/15/02, 4/16/02, 4/17/02
|
The Anals of Stock ProctologyPublished 5 times
per week by the American Academy of Stock Proctology and Please Don't Squeeze the Money (4/18/02)
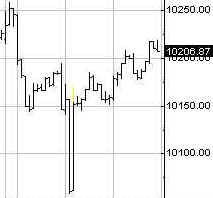
The Inflatables deflated just a bit Thursday after the big scare at mid-day on the Milan plane crash. The Dow closed at 10,205, still 200 points above its 10-13 week cycle projection of just under 10,000. That low appears to be drawing closer, and the after hours market with Mr. Softee melting down, suggests that "The Number" could be tested as soon as Friday. Doc warns against anticipating one way or the other what happens after that. The 10-13 week cycle oscillator could break down again if it's a bad day, and the fact that the last low was 10 weeks ago means that the forthcoming low is probable at any time between now and three weeks from now. Notice that just as the 10-13 is poised to turn up, the 6-7 week cycle oscillator is poised to turn down. This may yet play out in bears' favor over the next couple of weeks The Squeeze is On- Money That Is You'll get plenty of coverage of Mr. Softee's meltdown, and the Ebay selloff in the mainstream press, and on the Stool Piogeons Wire. Let's talk about what's really important. M-O-N-E-Y! Some folks were really worried today about that $10 billion in Feed we saw. But Doc wasn't worried. Here's why. The Federal Reserve System's open market account had a $10.9 billion Treasury Bill maturing today. Today's Feed merely replaced that, and then only with temporary repo paper. The charts below show clearly that the Fed is not feeding the monetary base aggressively, and the money supply is actually declining. They must be concerned that if they were to continue aggressively adding reserves, the bond market would collapse amid an explosion of inflation expectations. What happens next as a result of this unannounced policy shift is anybody's guess, but starving the financial system at this point seems destined to have a very bad outcome. The Fed reports changes in the monetary base every two weeks through the prior day. the adjusted monetary base fell in the week ended 4/17. According to data from the St. Louis Fed, the adjusted monetary base fell by nearly $4 billion to $662.5 billion. The Fed has either gotten mighty stingy, or they've lost the ability to blow flatulence into this rapidly imploding bubble. This is very bad news for the economy and stock market. These are the early signs that the Credit Bubble is indeed deflating. It was that bubble which fed both the markets and economic activity.
Based on the Fed's balance sheet data, it's not as if they weren't pumping at least a little. The Fed added a net of $3.8 billion in repo holdings last week, and $1.5 billion in paper bought outright, which along with other items added $5.2 billion to factors affecting reserve balances. So it may be more a question of it's out of their hands, than one of deliberate tightness. Either way, it's bearish news. The Fed has $37 billion in paper maturing in the next two weeks, of which $22 billion is repo agreements. Look for an average Feed of $18.5 billion per week or $3.7 billion per day just to stay flat. Keep in mind that it will take a lot more than that to jam the market. The guess here is that they won't jam, unless there's an absolute meltdown. The money supply data has a
one week lag. M1 and checking deposits are breaking down. M1 was down by
nearly, are you sitting down, $17 billion, in the week ended April 8. Unadjusted
it was down $45 billion! Next week's release could be even worse,
based on the adjusted monetary base data. This is a recovering economy?
Sorry, dead on arrival. MZM is a broad measure of
money which includes money fund assets. The engines of MZM growth are the
GSE's, Fannie Mae, Freddie Mac, and the massive mortgage bubble machine.
There's been ZERO growth since the end of 2001, and the collapse of the
refi bubble. The Fed is powerless to stop this. M3, not shown, fell by 16
billion on a seasonally adjusted basis. The decline in money fund
assets corresponds with the collapse of the refi bubble. We're starting to
see the repercussions in the monetary data, not to mention the weak stock
market, and soon, as a result, we are going to see another major financial
accident. It will probably show up first in the stock market. There's a direct correlation
between the collapse of the mortgage bubble, and the declining money
supply. This week the Mortgage Bonkers Association announced applications
were up very slightly through April 12. Significantly over the last three
weeks, there has been no pick-up in activity, in spite of a good
size drop in mortgage rates. Demand has been met. The question is whether
the implosion accelerates in the months to come. I wouldn't bet against
it.
Portfolio Sphincters Index (SPX) and Sentiment The VIX closed at 21.24, up from 20.18 the day before. Low option volatility complacency continues, and as long as it does, this down-up-down grind can continue indefinitely. On the inverted scale chart, VIX remains in the top band, indicating that a big decline should lie ahead, if we can rely ion the history of the last four years. The last big short term rally came from the 27-28 area. At this rate it will take weeks to get there, and a big intermediate swing rally probably won't come until the index is well above 30. The 17 day rate of change, a proxy for the 6-7 week cycle, is heading up but weakly so far. The 6-7 week cycle oscillator superimposed on the chart gave an early buy signal last week and continues to rise. These signals can be a little early or a little late, but this one gave plenty of warning that a rally was on the way. Now we need to watch for an early downturn in the indicator. The linear regression channel still suggests a tightly defined downtrend. Unless that's broken, bulls are in deep trouble. The 29 day rate of change, representing the 10-13 week cycle, is pausing but still negative overall.. The 10-13 week cycle down phase should limit the size of the upturn in the 6-7 week cycle, unless the 29 day rate of change also turns up. With the market's reaction to the MSFT and EBAY news, it seems unlikely, especially in view of the lack of monetary support. The blue channel lines are the extension of a linear regression channel from the February and May 2001 highs.
The cycle picture remains mixed, with the SPX locked between support at 1100 and resistance at 1130 along the 7 month trendline. The market does not have the strength to go higher, and the fact that it's unable to move strongly off key support suggests that a breakdown is out there. But when? From a cyclic standpoint there are two probable time periods, now, or June.
Minor fibo support levels are 1117 and 1112. Failing that we'll see a retest of 1100.
The Cycle Conditions tables include cycle phase and a wild guess as to number of periods to the next turn, in days for the shortest cycles, weeks (W) or months (M) for the longer ones. This is a fluid exercise, in other words, the projections are likely to be wrong, but they force us to be vigilant for key turning points, and frequently work well enough to prevent costly misreadings. SPX Cycle Conditions as of 4/18/02
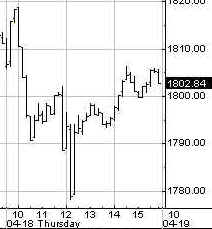
PTT - Periods Till Turn Nasgap Charts The Nas approached the underside of the uptrend line it broke, as well as the top of the cycle channel and ran out of gas. This is the 6-7 week cycle up phase. The action of the 5-6 month cycle oscillator now looks like that cycle is still in the throes of a dull sideways up phase that may last another month or break down at any time. We won't know until there's a better signal. The short cycle oscillator is up in a top zone. The 10-13 week cycle oscillator is still topping. The 5- 6 month cycle indicator remains in a weak up phase.
On the way down, minor fibo support levels are at 1778 and 1765.
Nasdaq Cycle Conditions as of 4/18/02
PTT
- Periods Till Turn Sucktor Watch Dirty Dirty SOX The dirty
dirty SOX spin cycle rally fell apart Thursday.
The little upticks in the oscillators do not impress Dr. Stool. Looks like
plenty of sellers waiting above 615. In other words, resistance. If the
10-13 week cycle oscillators managed to turn up over the next few days,
then I'd worry, but lets cross that bridge only when and if we get there.
The better likelihood seems like a whipsaw down. Stool Request Line Stock O' The Day - ROAD Roadway is the Stock 'O today sent in by stoolie "Depends", who said: "It has an ozark mountain over the hill formation and with fuel prices increasing their poor earnings report is not helping (as it would if this were a semi-conductor stock). It is currently overvalued too, but I don't think that will last." Doc, says, nice looking chart from a bear's perspective of course. Next stop, 30. Then let's see what the bounce looks like.
I still have a few Stock'O's in the queue, but if you have an idea for one, send it to [email protected]. Include some original reason for why you think the stock is deserving. Be clever! Anything longer than 25 words- automatic disqualification! And please, no penny stocks. Stoolwethers- World's Largest Criminal Organization As the world
knows, Mafiasoft reported after the bell. The red bar shows the range in
the aftermarket. The stock closed at 54.77, almost all the way back to the
level formerly known as support, at 55. Now you don't suppose some big
institution, whose name begins with "F"... you don't suppose the
"F" in institution, might have engaged in a little support
operation there do you? Of course not. As for what happens when the market
opens, it's not clear. There are a number of indications that a cycle low
wants to form in the 50-52 area over the next week or two. There are probably
a lot of bottom sniffers who'd be willing to step up at 50. The lower
cycle channel bands are usually pretty good support areas. We'll see. Golden Stool The gold stocks made the double top scenario, by hitting 105 then closing on the low. The eventual breakout looks like as close to a sure thing as there is in this business. But will it come sooner or later. The gold stock index continues moving sideways as the cycle oscillators correct. This is a sideways down phase, often the precursor to a sharp up move. It's possible the index could breakout above the centered long term linear regression projection and move into the top half of the channel projection. It also might continue correcting for awhile. If it does break out, it's the real thing.
We're
seeing conflicting indications here. On the one hand there are indications
of an intermediate top, and on the other hand, a short term low. The
uptrend is still intact and a short cycle upturn is due. The strength of
that, or lack thereof, will tell us how much inflation expectations are
building. With the index sitting on the trendline, what happens next is
extremely important to the longer term outlook, not just for bonds, but
for everything. The sphincters refuse to sell their stocks as long as the denominator
on that income capitalization formula stays low. Of course another big
drop in bond yields may presage the double dip, and the final
disappearance of earnings as we knew them. Uncle Buck's Illness Rest In
Peace, Uncle Buck. Well, maybe not so fast. He's been know to come back
from the dead, you know! See you in Intraday Stool. Dr. Stepan N. Stool Let me know what you think on the Stool Pigeons Wire. Welcome To New Subscribers Welcome, and thank you for subscribing to the Anals of Stock Proctology. You may note some subtle differences in style now that this is no longer a free service. The perspective is still bearish, but it will have a more balanced approach than my message board ravings. You won't see me screaming "BUY" about anything except perhaps gold, but you will see stronger indications of areas and times when I think it might be a good idea to avoid being short. And I promise that I will lose my temper from time to time to keep you entertained! There's also a new feature, Doc's By Request Stock O' The Day. If you have a stock you're interested in, send an email to [email protected], naming the stock, and why you think Doc should look at it, in 25 words or less. 26 words, and you're disqualified! Those that look interesting, Doc will try to feature here within the next day or two. If you have suggestions about other features you'd like to see, send them along to [email protected]. Again, thanks for subscribing!
|
![[Most Recent XAU from www.kitco.com]](http://www.weblinks247.com/indexes/idx24_nasdaq_en_2.gif)
![[Most Recent XAU from www.kitco.com]](http://www.weblinks247.com/indexes/idx24_sp500_en_2.gif)
![[Most Recent Quotes from www.kitco.com]](http://kitconet.com/charts/metals/gold/t24_au_en_usoz_2.gif)

 Chart Powered by METASTOCK