|
10 Minute Bar Charts 4/24/02 Dow Jokes Inflatables
Archives 12/30/01, 1/1/02, 1/2/02, 1/3/02, 1/4/02, 1/7/02, 1/8/02, 1/09/02, 1/10/02, 1/11/02, 1/14/02, 1/15/02, 1/16/02, 1/17/02, 1/18/02, 1/22/02, 1/23/02, 1/24/02, 1/25/02, 1/28/02, 1/29/02, 1/30/02, 1/31/02, 2/1/02, 2/4/02, 2/5/02, 2/06/02, 2/7/02, 2/9/02, 2/11/02, 2/12/02, 2/13/02, 2/14/02, 2/16/02, 2/19/02, 2/20/02, 2/21/02, 2/23/02, 2/25/02, 2/26/02, 2/27/02, 2/28/02, 3/1/02, 3/04/02, 3/05/02, 3/06/02, 3/7/02, 3/10/02,3/11/02, 3/12/02, 3/13/02, 3/14/02, 3/15/02, 3/18/02, 3/19/02, 3/20/02, 3/21/02, 3/22/02, 3/25/02, 3/26/02, 3/28/02, 3/30/02 4/1/02, 4/2/02, 4/3/02, 4/4/02, 4/6/02, 4/8/02, 4/9/02, 4/10/02, 4/11/02, 4/13/02, 4/15/02, 4/16/02, 4/17/02, 4/18/02, 4/20/02, 4/22/02, 4/23/02,4/24/02
|
The Anals of Stock ProctologyPublished 5 times
per week by the American Academy of Stock Proctology and PM Outlook (4/25/02) The market got close to the intraday cmaps suggested by the futures in the early going. The 5 hr cycle high also came on schedule at 10:30 and the 1 day ozzies now look to be topping here at about 1 PM. The 8 day ozzies are in a trough, but there are no solid signs of an upturn. The 13 day cycle looks to be ruling. That is still down with cmaps of 1170-75 on the SPX and 1675 on the Nas. Very preliminary cmaps on this 5 hr cycle down phase are 1077 and 1690 with a 5 hr low due at 3 PM, and 1 day cycle low at the close or early tomorrow. Just as I'm getting ready to post this, the 1 day cycle ozzie is barely starting to roll over to the downside. Pre Market Outlook 4/25/02 The market was weak at the bell yesterday at what should have been the 1 day cycle low, but futures indicate an extension of the downside this morning. The cycle low should come in the first hour. The 8 day cycle low was due yesterday, and looked like it was forming until late in the day when the 8 day cycle ozzie whipsawed back to the downside at extremely low levels, a sign that the 13 day cycle may be making its return. If the 13 is control, the bottom isn't due for 4 more days on the Nas and 5 days on the SPX. The cmaps on the 13 day cycle, based on the hourly charts are 1670-80 on the Nas and 1070 +/- on the SPX. The 1 day cmaps were 1712 and 1093. Those will be exceeded on the open, but the cycle low should come soon after. Cmaps for this cycle on the fucutures are 1082 and 1291 on the ND 100. (1291? Sounds funny.) That would translate to a 20-25 point drop on the Nas, to about 1690-95. Look for a 5 hour cycle high at 10:30, followed by the 1 day highs in the noon to 1 PM period. Assuming that bounce is uninspiring, the PM should show accelerating weakness as the 13 day cycle down phase continues. But we want to be on the lookout for signs of an 8 day cycle low, just in case. A strong bounce and mild pullback would signal that, with a swup following for 2-3 days. AM Updates Below Uncle
Buck
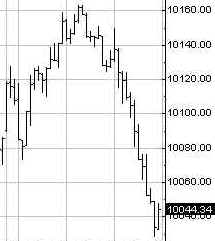
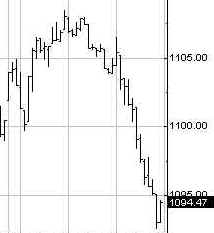
The Dow Inflatables deflated yet again on Wednesaday, this time by 44 points, in a market that is declining slowly enough to lull bulls into a false sense of security. The 13 day and 4-5 week cycle oscillators have now flashed clear sell signals, while the 10-13 week oscillator continues to mark time at a negative level. The 6-7 week cycle oscillator is poised to turn down after a 3 week long sideways up phase. The 10-13 week cycle centered moving average projection is at 9775-9925. The downturn in the 4-5 and 6-7 week cycles getting in gear with the final stage of decline in the 10-13 week cycle could force the projections lower. The current consolidation pattern now measures a move to 9600-9800, with the 10-13 week cycle low due at any time over the next 3 weeks. The Feed was only slightly positive today, adding only a $2 billion overnight repo to refund yesterday's $1.5 billion. So far this week the Feed has apparently been neutral, not adding enough to grow the base at all. This continues the trend of stinginess from last week and the last few months. Tomorrow a $983 million T-Bill in the Fed's Open Market Account will mature. There's also a refunding of a 28 day repo coming up. If we see any really big Feeds this week, keep in mind there's always paper to be rolled, and when the Fed is adding less than an average of $3 billion to $3.5 billion per day over the course of the week, the stock market is likely to be hurting. The durable goods report is a non-issue, as is all other economic data, because it's all ancient history. Just follow the money, and you'll know what the data's going to look like. Will knowing that help you trade the market any better. No. The market is its own message. If you read the message of the market, then you'll know what the monetary data will look like, and if you know the monetary data, which, depending on the series lags the actual by anywhere from a day to a week, then you'll be able to guess the direction of the economic data, which always lags by at least 3 to 4 weeks. So why are we studying economic data from a month ago when we want to know what the market is going to do today and tomorrow and next week? OK for some of us, two weeks. Well, it's fun to laugh at what the poodits say about it, or to capitalize on a knee jerk reaction in the "wrong direction", but as for divining the market's future? Don't waste your time. The money is the market is the economy, and the market is the money, and the economic data just reflects that a month after the fact. The one piece of economic data which is important is the Mortgage Bonkers Mortgage Application Index, which came out today, and was up a fair bit. Unfortunately, due to computer problems I don't have access to the historic data today, so I can't show you the relative importance of the jump in apps. But refi's which were the driver of the credit bubble remain relatively low compared to where they were two months ago. Funding follows application by four to eight weeks, so any change in the applications trend will show up in the money supply data a month or two down the road. That's when it will impact the stock market and the economy. For now, given the passive Fed and weak money creation as a result of the recent sharp decline in mortgage apps, stocks will remain under pressure. If another small bulge is starting as a result of the recent decline in mortgage rates, we have a few weeks before we need to worry about the impact on the market. Tomorrow night I'll have the mortgage bubble chart, along with the monetary data. Portfolio Sphincters Index (SPX) and Sentiment The SPX lost another 7.82. The 17 day rate of change, a proxy for the 6-7 week cycle, stalled after beginning to head weakly higher last week, and now has whipsawed back to a sell signal. This cycle has been heavily skewed to the downside, with only very short uplegs. This downleg could last 4 or 5 weeks, unless an upturn in the 10-13 week cycle intervenes. The 6-7 week cycle oscillator superimposed on the chart started to roll over as well. Price is leading the indicators because of the cycle skew to the downside. Late sell signals are usually extremely bearish. The short term linear regression channel continues to show a tightly defined downtrend continuing. The 29 day rate of change, representing the 10-13 week cycle, is still down. If it breaks the double bottom look out below. The VIX closed at 22.68, up from 22.13 Tuesday. Option volatility is beginning to increase ever so slightly. On the inverted scale chart, VIX has begun to drop below the top band, indicating that the big decline may finally be starting in earnest. The down day finally reversed the trend of decreasing volatility that began at last September's lows. The last big short term rally came from the 27-28 area, and a big intermediate swing rally probably won't come until the index is well above 30. At this rate, we have a few weeks to worry about it. The blue channel lines are the extension of a linear regression channel from the February and May 2001 highs.
This may be the Big One. The 5-6 month cycle oscillator has begun to move down, and everything else is getting in gear with the 10-13 week cycle having as much as 3 weeks to go before a trough.
Fibo support levels are 1100 (His-to-ry, now resistance) and 1075-80, then 1062 and so on. These will, of course, become known, in due time, like the artist formerly known as Prince, as "levels formerly known as support".
The Cycle Conditions tables include cycle phase and a wild guess as to number of periods to the next turn, in days for the shortest cycles, weeks (W) or months (M) for the longer ones. This is a fluid exercise, in other words, the projections are likely to be wrong, but they force us to be vigilant for key turning points, and frequently work well enough to prevent costly misreadings. SPX Cycle Conditions as of 4/24/02
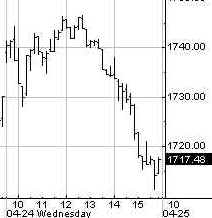
PTT - Periods Till Turn Nasgap Charts The Nas shed another 28. This is a classic picture of a trendline breakdown, return to the scene of the crime, and fall away. The index is back to the center of its downtrending cycle channels. Short cycle oscillators are heading down. The 6-7 week and 4-5 week cycles appear to be heading down. This is either an early bottom to the 10-13 week cycle (NOT) or the beginning of a breakdown from yet another gigantic distributional top. The 5-6 month cycle oscillator is on the verge of a downturn from below neutral, usually a sign of impending disaster. The 8 and 13 day cycles are still a question mark, though. The 8 day cycle low is overdue and could still generate a bounce, but it would be temporary. If the 13 rules here, we'll see 3-4 days of straight down action, as all cycles will be momentarily in gear to the downside.
Fibo support levels are at 1699, which is the old low, and 1660.
Nasdaq Cycle Conditions as of 4/24/02
PTT
- Periods Till Turn Sucktor Watch Dirty Dirty SOX The dirty dirty SOX broke down yesterday and may be poised to accelerate. Support around 515.
Retail Index One of the
drivers of "this bull market" has been the Retail Sector. It's a
little early to know for certain, but the position of the cycle indicators
suggest a distributive top is near completion. Stoolwethers- AhOL Doc's been wailing on this one for a long time. They reported a $54 billion dollar loss for the quarter. Ho hum, beat the Street. It's up in the pre-market. The chart speaks for itself. The decline isn't finished.
Sent in by stoolie Greg, CACI has an interesting chart. Sure looks like a major distributional top. There's trend support here in the 32 area. Once that 5-6 month cycle oscillator turns down, things will be in gear for a big drop.
If you have an idea for a Stock O', send it to [email protected]. Include some original reason for why you think the stock is deserving. Be clever! Anything longer than 25 words- automatic disqualification! And please, no penny stocks. Feel free to request follow-ups too. Uncle Buck's Illness They've begun lowering the coffin. Getting pounded again this morning, 115.50 at 8 AM in NY. Could see short term support at this level. If it breaks, look for acceleration.
Golden Stool The Amex
Goldbugs Index remains in a cyclic correction while price inches higher. This is
normally powerfully bullish. The consolidation is likely to eventually lead to an explosive upside breakout.
That said, it does not rule out a pullback before the breakout. As long as
the 10-13 week cycle indicators remain positive, the trend is confirmed.
If they however turn down, expect a deeper, more prolonged period of
consolidation Bonds
rallied and yields fell sharply. The uptrend is broken and a move down to
at least 4.90 looks to be in the cards. Deflation anyone? See you in Intraday Stool. Dr. Stepan N. Stool Let me know what you think on the Stool Pigeons Wire. Welcome To New Subscribers Welcome, and thank you for subscribing to the Anals of Stock Proctology. You may note some subtle differences in style now that this is no longer a free service. The perspective is still bearish, but it will have a more balanced approach than my message board ravings. You won't see me screaming "BUY" about anything except perhaps gold, but you will see stronger indications of areas and times when I think it might be a good idea to avoid being short. And I promise that I will lose my temper from time to time to keep you entertained! There's also a new feature, Doc's By Request Stock O' The Day. If you have a stock you're interested in, send an email to [email protected], naming the stock, and why you think Doc should look at it, in 25 words or less. 26 words, and you're disqualified! Those that look interesting, Doc will try to feature here within the next day or two. If you have suggestions about other features you'd like to see, send them along to [email protected]. Again, thanks for subscribing!
Explanation of Intraday Commentary-Build charts at http://www.livecharts.com. For custom time bars insert a comma after symbol and number of minutes, e.g. compx,90. This will give you a bar chart of the Nas with 90 minutes per bar. The one day cycle is usually most clear with 8 minute bars and 26/18 stochastics. It varies from day to day. Sometimes 6 minutes works best. Experiment to find the best fit for your trading style, and the market's dominant frequency at the time. The goal here is primarily to monitor the condition of the 8 and 13 day cycles. I typically use 90 minute bars with 26/18 stochastics for the 13 day cycle proxy on the indices during regular trading hours. Other cycles use 26/18 stochastics with the following: 8 days- 60 minute bars On the 24 hour futures charts, use a time per bar approximately 3 to 4 times the above number of minutes, to represent the cycles listed above. ABBREVIATIONS: cma: centered moving average |
![[Most Recent XAU from www.kitco.com]](http://www.weblinks247.com/indexes/idx24_nasdaq_en_2.gif)
![[Most Recent XAU from www.kitco.com]](http://www.weblinks247.com/indexes/idx24_sp500_en_2.gif)
![[Most Recent Quotes from www.kitco.com]](http://kitconet.com/charts/metals/gold/t24_au_en_usoz_2.gif)
 Chart Powered by METASTOCK