|
10 Minute Bar Charts 4/5/02 Dow Jokes Inflatables
Archives 12/30/01, 1/1/02, 1/2/02, 1/3/02, 1/4/02, 1/7/02, 1/8/02, 1/09/02, 1/10/02, 1/11/02, 1/14/02, 1/15/02, 1/16/02, 1/17/02, 1/18/02, 1/22/02, 1/23/02, 1/24/02, 1/25/02, 1/28/02, 1/29/02, 1/30/02, 1/31/02, 2/1/02, 2/4/02, 2/5/02, 2/06/02, 2/7/02, 2/9/02, 2/11/02, 2/12/02, 2/13/02, 2/14/02, 2/16/02, 2/19/02, 2/20/02, 2/21/02, 2/23/02, 2/25/02, 2/26/02, 2/27/02, 2/28/02, 3/1/02, 3/04/02, 3/05/02, 3/06/02, 3/7/02, 3/10/02,3/11/02, 3/12/02, 3/13/02, 3/14/02, 3/15/02, 3/18/02, 3/19/02, 3/20/02, 3/21/02, 3/22/02, 3/25/02, 3/26/02, 3/28/02, 3/30/02 4/1/02, 4/2/02, 4/3/02, 4/4/02
|
The Anals of Stock ProctologyPublished 5 times
per week by the American Academy of Stock Proctology and Champagne Money Machine, Out of Bubbles? (4/06/02)
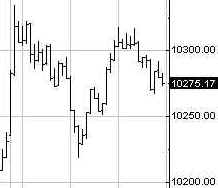
The Dow managed to hang on to a small gain Friday, while the bulls sweated a threatened breakdown all day in the Nasgap and Portfolio Sphincters Index (SPX). The Dow is afflicted by mixed cyclicality. The 8 day cycle turned up. The 13 is still down. The 4-5 week cycle is in a very weak sideways up phase, and the 6-7 week cycle is trying to form a low. The 10-13 week cycle remains down and may be on the verge of accelerating. But there's a reason why I this is the Dow Jokes Inflatables. The strength in the Dow was due to the action of three stocks, MMM, AA, and CAT. The stage managers did their jobs today, getting the story they want the public to see on the evening news. Eventually however, the repetition of strength in the Dow against the backdrop of a weakening broader market has the reverse effect. The sheeple check their stocks and see that they were down, while the Dow was up, time and again. Eventually the discouragement will take its toll. Lots more tomorrow. The Champagne Money Machine The Fed reported an increase in credit holdings of $6.9 billion, in the week ended Wednesday. This was a week to week change of about 1%, almost all of which was in temporary repurchase agreements ranging from overnight to 28 days. It was the first big jump in several weeks. Total factors supplying reserve funds were $688.6 billion, a 9% year to year increase, a drop of 1% over the last 3 months, and an increase of 0.8 % in the past 4 weeks. It looks from here that lack of money growth in the past couple of months was too much for the Feed to bear, so they stepped on the gas a little last week. This chart of adjusted reserves
through March 20 shows that reserves had been flat since last November. Over the 15 days beginning last Thursday approximately $13 billion in US government securities held by the Fed will be maturing. An additional $22.5 billion in short term repurchase agreements will come due, for a total rollover of $35.5 billion or $3.5 billion per day. Thursday the Feed gave us a $5 billion in 28 day repos, but let $6.5 billion in overnight repos expire. Then Friday, they again took no action. So it does not appear that there's been any change in the less accommodative posture, nor any direct feeding of the stock market. We'll have to watch closely whether Al's Bakery bakes up more dough if the market finally takes the pipe this week. M1
took a rather huge jump of 6.7 billion on a seasonally adjusted basis in
the week ended March 25. The growth rate is 5.2% over the last 13 weeks.
That compares with 7.5% over the lat 12 months. The Feed continues
to pour enough gas on the fire to keep the high powered M1 growing along
the same trend it has been on since the beginning of 2001. Is it any
wonder that we have rampant inflation in housing, energy, and services? But in spite of having its
pedal half way to the medal, broader money is no longer cooperating. M3
dropped by over $21 billion in the March 25 week. Seasonally adjusted the
figure was only $9 billion. In the last 2 months M3 growth has stalled. The reason is obvious. The mortgage bubble is deflating. As Doug Noland points out in the Credit Bubble Bulletin, other asset backed securities bubbles are popping up, but whether they'll be enough to sustain the bubble economy is the question. The flattening in M3 is clearly an ominous sign for both the stock market and the bubble economy. The Mortgage Bonkers reported a slight drop in loan applications in the week ended March 29. All of that was attributable to a huge drop in refi's.
The refi bubble is kaput, and it was this bubble that has kept the stock market and the economy afloat. It was a one time windfall that saved the bulls for a few months. We saw the effects of the bulge working its way through the market through the fourth quarter. Now we're seeing the after effects, and it ain't pretty. Even if long rates simply stay where they are, the market will starve for liquidity.
Portfolio Sphincters Index (SPX) and Sentiment The VIX closed at 21.11, down from 21.77 Thursday. It remains in a top zone, just above the 20 level (inverted on chart) which has been the precursor to big declines over the past four years. Complacency remains extraordinarily high, given the losses in recent weeks. The 17 day rate of change, a proxy for the 6-7 week cycle, is trying to find a low, due within 1-6 days. It is now below the zero line. When that happens trends often accelerate. A 6-7 week cycle oscillator is superimposed on the chart. It is also approaching a low. Things gets trickier as the low gets closer. Prices could spike down for a few days before they reverse, or they could form a saucer bottom. The spike is looking more likely. The 29 day rate of change, representing the 10-13 week cycle, looks like a sell signal, but as long as it continues to creep along its smoother, the assumption is that the top of that cycle is not yet complete. Down 40 points from the high, and the down phase hasn't even started! That should give us some idea of what may lie ahead. First the market needs to do some work in the 6-7 week cycle up phase that's coming over the next week or two. That up phase should be of limited duration and amplitude, given the concurrent down phase in the 10-13 week cycle. Things could get dramatically weaker around Tax Day, and stay weak through the end of the month. For those seeing this chart for the first time, the blue channel lines are the extension of a linear regression channel from the February and May 2001 highs.
The 5-6 month and 10-13 week cycle indicators have turned down from low levels, and in the case of the 5-6 month indicator, very early. This normally suggests extended, severe weakness. If the short cycle oscillator is also turning down at low levels, that also often means a severe short term down, but Thursday it backed off from that signal. There's some trend support here. The big question is whether it will hold or gap down Monday morning.
1123 is a 50 % retracement of the prior rally from 1080. The next level to the downside is 1111, then 1095.
The weekly chart gives an extraordinary perspective on just how
perilous the current situation is. The Cycle Conditions tables include cycle phase and a wild guess as to number of periods to the next turn, in days for the shortest cycles, weeks (W) or months (M) for the longer ones. This is a fluid exercise, in other words, the projections are likely to be wrong, but they force us to be vigilant for key turning points, and frequently work well enough to prevent costly misreadings of the market. SPX Cycle Conditions as of 4/5/02
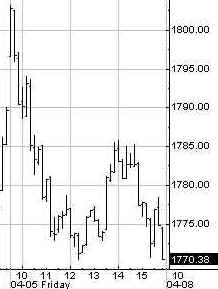
PTT - Periods Till Turn Nasgap Charts The Nas was flirting with a trendline connecting the September and February lows, and broke it late Friday. Off the coming 6-7 week cycle low, the index may shinny along the line for a few days, or it could spike down and then rebound. The six month cycle oscillator remains weak in negative territory, and remains perilously close to a breakdown which, coming from these levels, would signal extreme weakness.
Breaking 1772, the next fib level going down is 1715.
Again, the
weekly chart illustrates the extreme nature of the current risk in the
market. Nasdaq Cycle Conditions as of 4/5/02
PTT
- Periods Till Turn Sucktor Watch- Energy The energy
sector has made a significant intermediate cycle high. However, the shape
of the down phase is in question and will take a few more days to sort
out. Will it be a range consolidation, or a correction deep into the base?
Either is possible, and we'll need to wait out the conclusion of this phase
before the direction of the long term trend can be ascertained. Dirty Dirty SOX Nothing new again Friday. However, the 10-13 week cycle is in the time frame for a downturn. A couple of downticks from here would signal an early downturn in the 6 month cycle from weak levels, and would signal extended, severe weakness.
Stool Request Line Stock O' The Day Today's
winner is EMC. I picked this one because the storage sector has been in
the news so much of late, with bombs dropping left and right. A year ago,
every big shot analcyst in the world had a strong buy EMC. Over the last
couple of months, the stock has been in a prototypical SWUP, a sideways up
phase, that usually serves a a consolidation leading to a big drop. A
person reading the momentum indicators will say, oh boy, look at all those
positive divergences! I think they're in for a nasty surprise when the
bottom drops out. I still have a few Stock'O's in the queue, but if you have an idea for one, send it to [email protected]. Include some original reason for why you think the stock is deserving. Anything longer than 25 words- automatic disqualification! Golden Stool The gold stocks have started the short cycle down phase we've been expecting. Keep an eye on the 10-13 week cycle oscillator. A rollover from these levels would be bearish. For now I'm still betting on a shallow correction.
The short cycle on the 10 Year Treasury Yield is coming into a low over the next few days, and the intermediate wave is up. The next day or two will be crucial in determining the slope of the intermediate uptrend. It's too early to tell if this drop is just a wobble in the intermediate trend or the beginning of a more significant reversal. The negative divergences need to be watched. If the intermediate momentum indicators turn down from these levels, yields could head down back to the 5% area. It looks like a short term low should form in a day or two. Once we see the following move up, we'll have a better idea about the intermediate trend.
Uncle Buck's Illness Uncle Buck (the dollar) continues to hang on in the 117-118 area, and it looks like he'll do so for a few weeks yet. If his health-o-meter drops under 117.25, start making funeral arrangements.
See you in Intraday Stool. Dr. Stepan N. Stool Let me know what you think on the Stool Pigeons Wire. Welcome To New Subscribers Welcome, and thank you for subscribing to the Anals of Stock Proctology. You may note some subtle differences in style now that this is no longer a free service. The perspective is still bearish, but it will have a more balanced approach than my message board ravings. You' won't see me screaming "BUY" about anything except perhaps gold, but you will see stronger indications of areas and times when I think it might be a good idea to avoid being short. And I promise that I will lose my temper from time to time to keep you entertained! I'll also be adding a new feature, Doc's By Request Stock O' The Day. If you have a stock you're interested in, send an email to [email protected], naming the stock, and why you think I should look at it, in 25 words or less. 26 words, and you're disqualified! Those that look interesting, I'll try to feature here within the next day or two. If you have suggestions about other features you'd like to see, send them along to [email protected]. Again, thanks for subscribing. Now, let me get to work!
|

![[Most Recent XAU from www.kitco.com]](http://www.weblinks247.com/indexes/idx24_nasdaq_en_2.gif)
![[Most Recent XAU from www.kitco.com]](http://www.weblinks247.com/indexes/idx24_sp500_en_2.gif)
![[Most Recent Quotes from www.kitco.com]](http://kitconet.com/charts/metals/gold/t24_au_en_usoz_2.gif)
 Chart Powered by METASTOCK